
track.easterbunny.cc (v5.6)
track.easterbunny.cc Version 5.6 is the fourth run of track.easterbunny.cc - the Easter Bunny Tracker that I maintain.
Culminating on three years of work, with a major refactor ahead, this version included smaller refinements to an already ground-breaking tracking experience.
Combining the fan base from last year with new visitors, track.easterbunny.cc v5.6 achieved 127,000 hits in the 28 hours of tracking, and 145,000 hits in about 3 days time.
track.easterbunny.cc continues to be my largest and proudest project - combining frontend design, backend programming, high-scalability design, optimized SEO, and social media management all into one project with real-world implications. All done by myself.
—
Lines of code: ~16,000
Languages: HTML, CSS, JavaScript, Python
Frameworks: jQuery, Material Design Bootstrap, Flask, Cloudflare (CDN), MaxMind 2 (Geo API), Twython (Twitter for Python), in addition to custom toolchains.
Timeframe: March 2022 - April 2022 (this was when v5.6 was under active development - track.easterbunny.cc has been active since January 2019)
—
You can visit this project at https://track.easterbunny.cc.

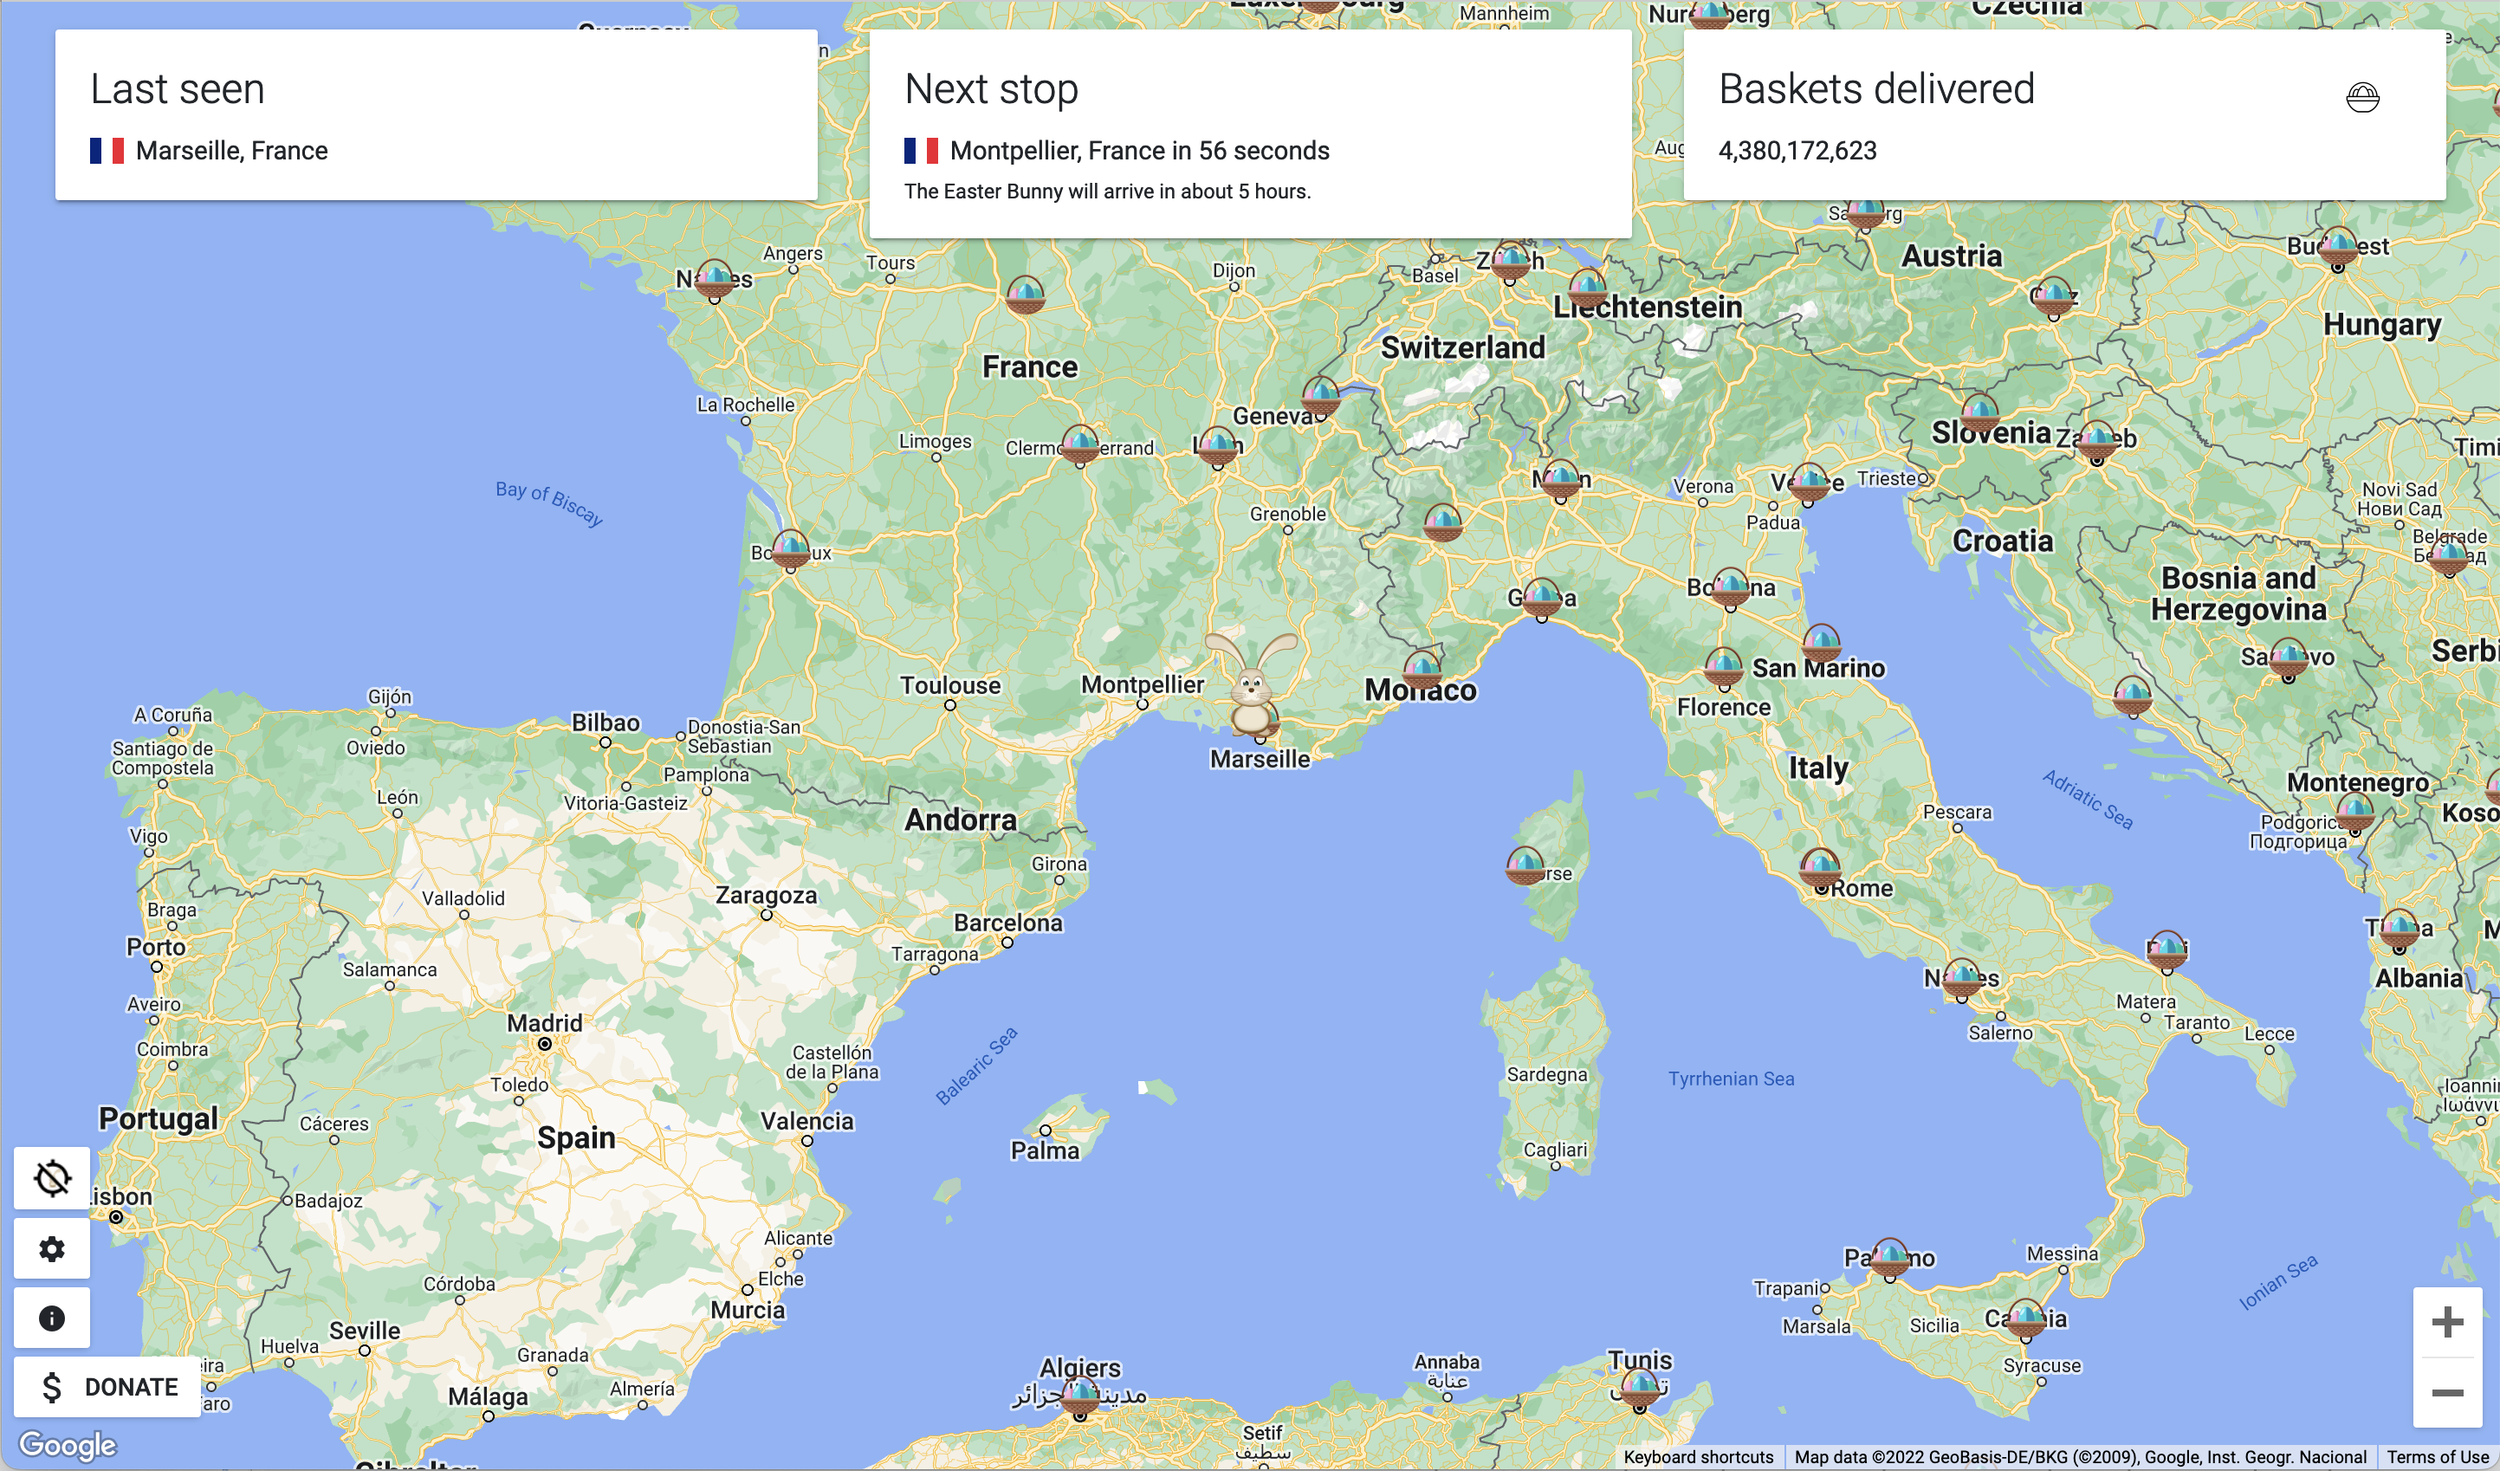
This is the main tracker interface when you visit the website. The design of the tracker takes inspiration from the NORAD Santa Tracker while also keeping things as simple and clean as possible. The new color style from Google Maps was adopted this year.
At it’s core, track.easterbunny.cc is a truly client-side tracker. That means that once the tracker loads, all the data and code needed to run the tracker until the end of tracking is stored by the client, and the tracker never reaches out to my server again. While this does mean the initial load without browser caching is ~2 MB, that’s a small price to pay given I’ve seen partially server-side trackers go down under high traffic loads.
With the help of Cloudflare, I was able to get the tracker to basically only hit my origin server for the IP location API (more on this later). Between the 99+% cache rate on Cloudflare, plus the truly client-side design, this tracker is incredibly scalable.
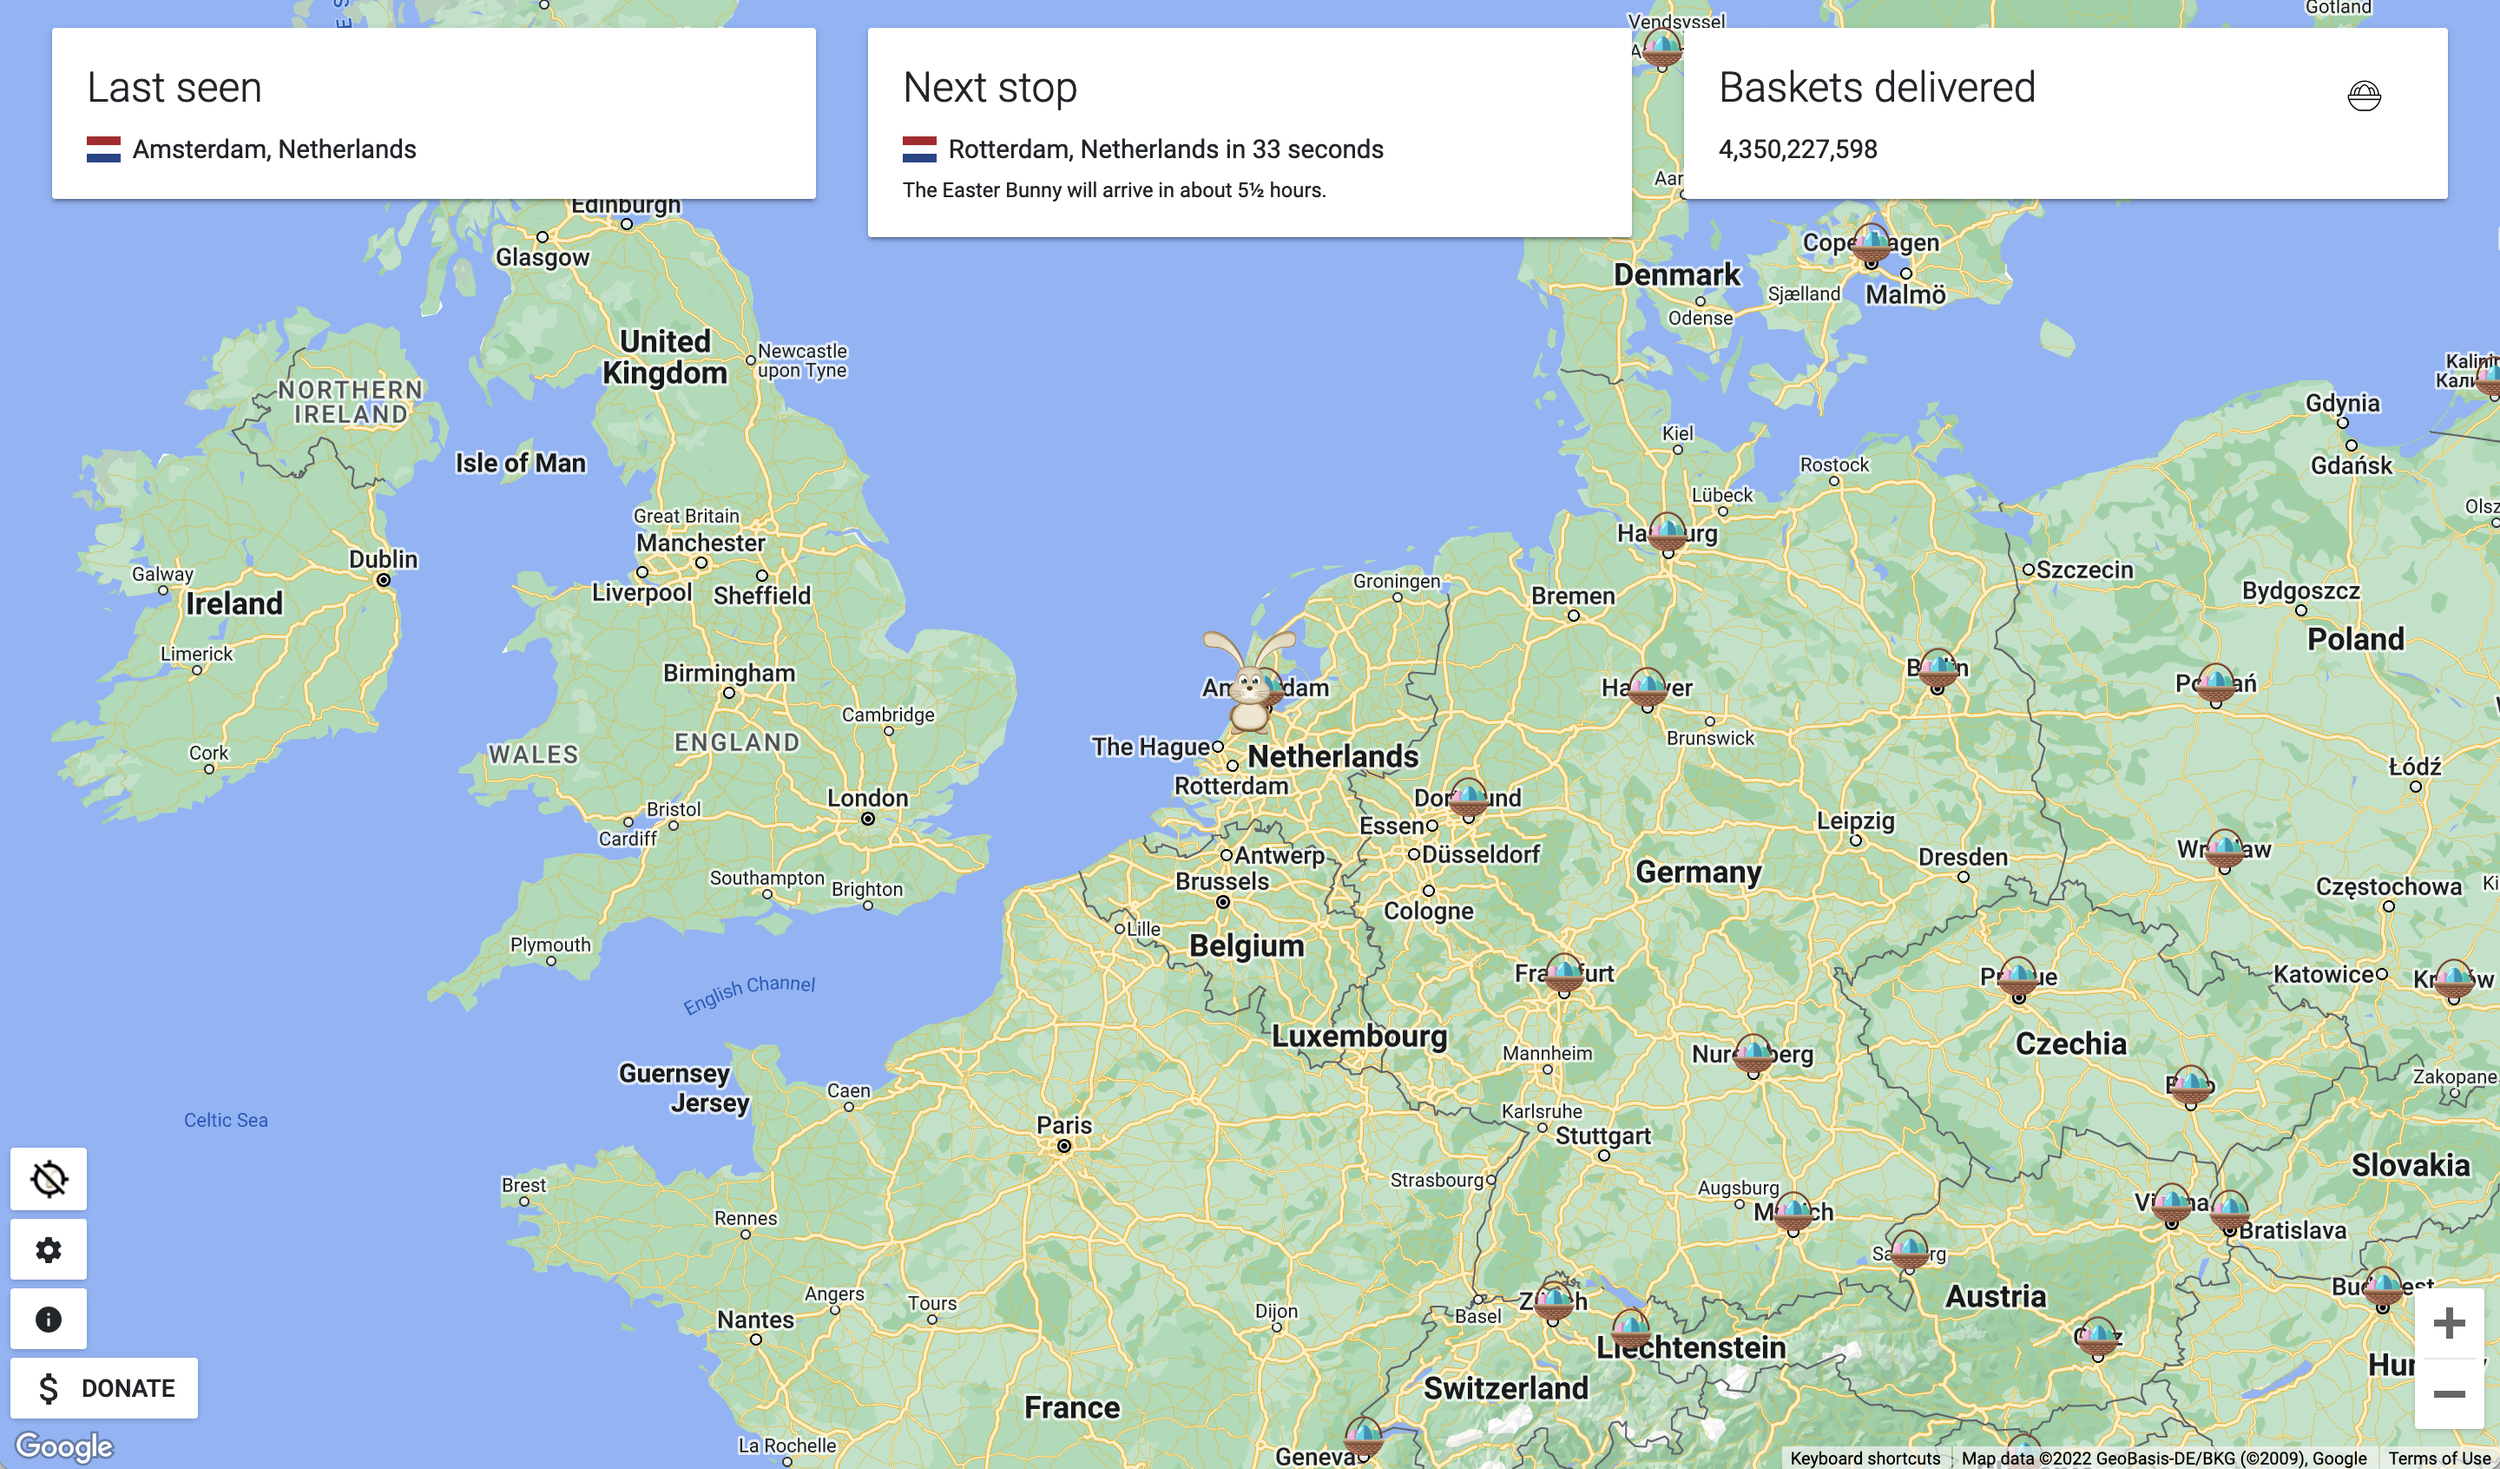
The Last Seen, Next Stop, and Baskets Delivered fields are pretty standard for any tracker. This year, I added the flag of the country for the last seen and next stop boxes.
Additionally, the tracker’s updates (map & metrics) were sped up by 2x this year, with options for even smoother settings.

Clicking on the icon in the baskets delivered box changes the metric. You can cycle through five metrics - baskets delivered, carrots eaten, distance traveled, speed, and distance from you.
The next stop houses the Easter Bunny’s arrival time estimate. This is calculated using your IP location from a custom IP location API, and then doing lots of math client-side to figure out the arrival time.
The bottom left houses three buttons - one for uncentering/recentering the map on the Easter Bunny, one to open settings, and one to open an info window. The donate button is new for this year.
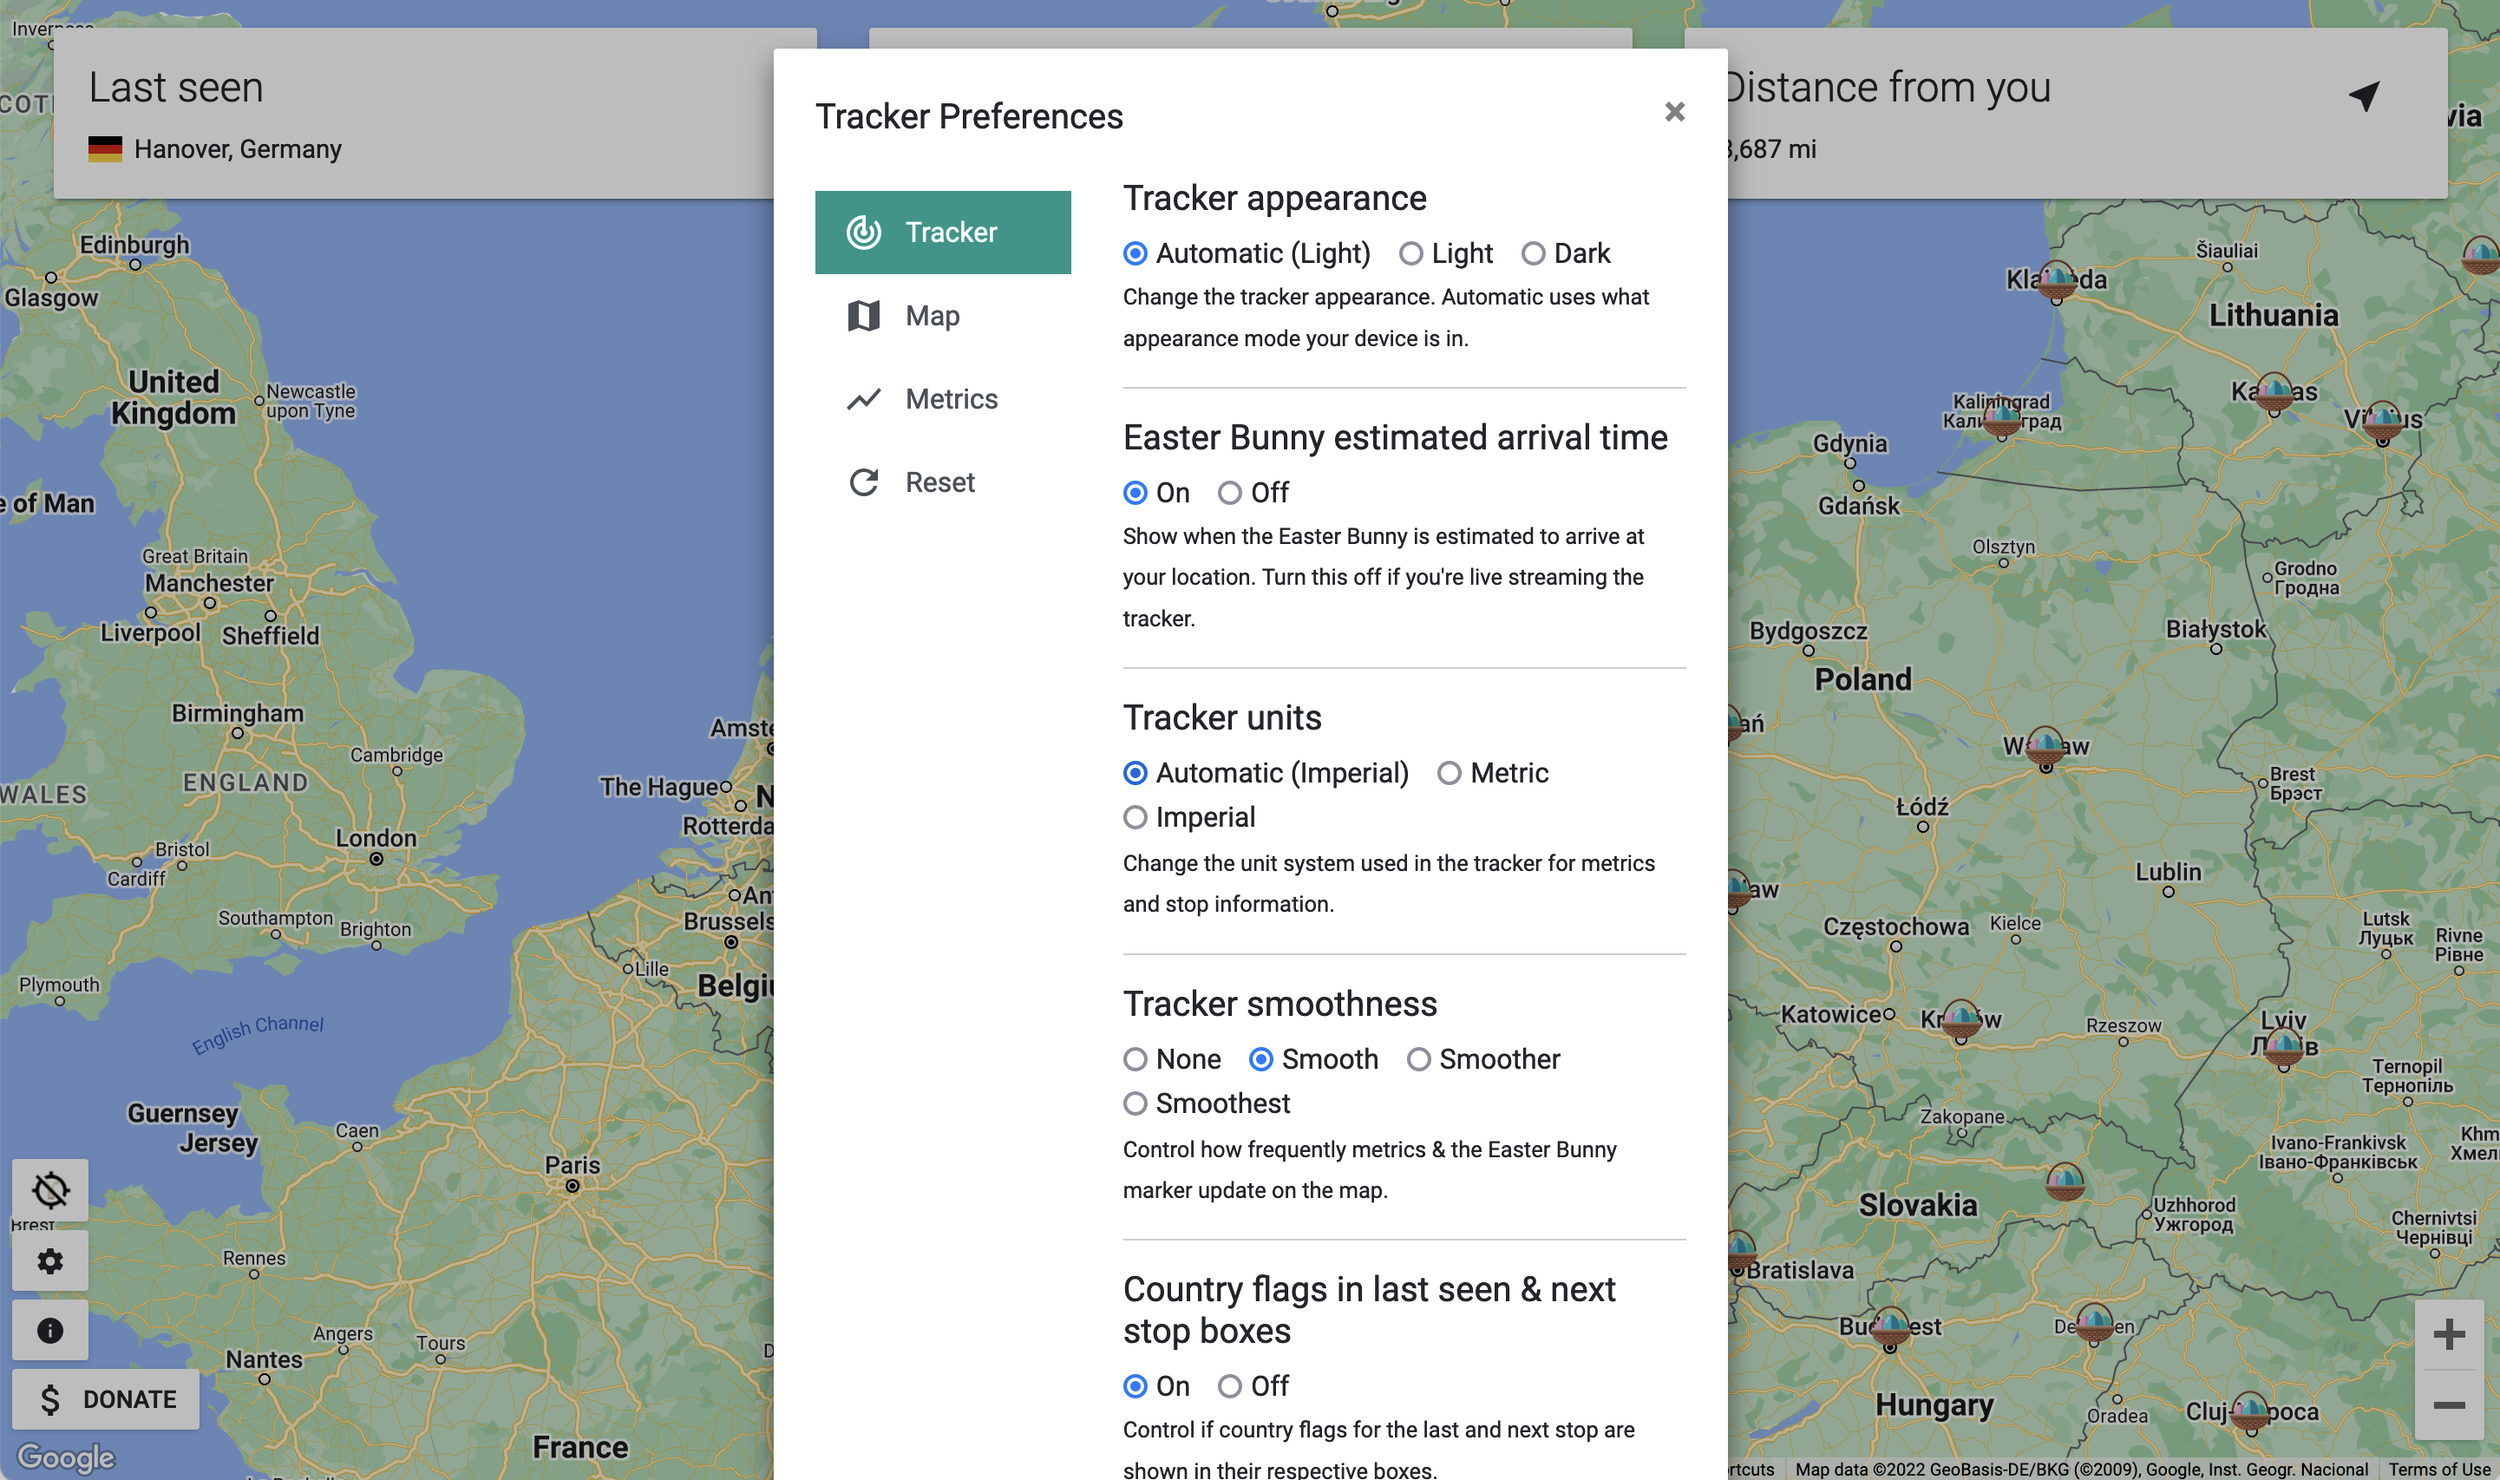
One of the flagship features of track.easterbunny.cc is the extensive customization. This is unheard of in any tracker, and users can basically change anything they want in the tracker to make their own experience.
The settings window has four tabs for four distinct types of settings. The first, and most commonly used tab, is the tracker tab. This is where users can control the appearance of the tracker, how smooth the tracker runs, in addition to hiding the Easter Bunny arrival time on streams.
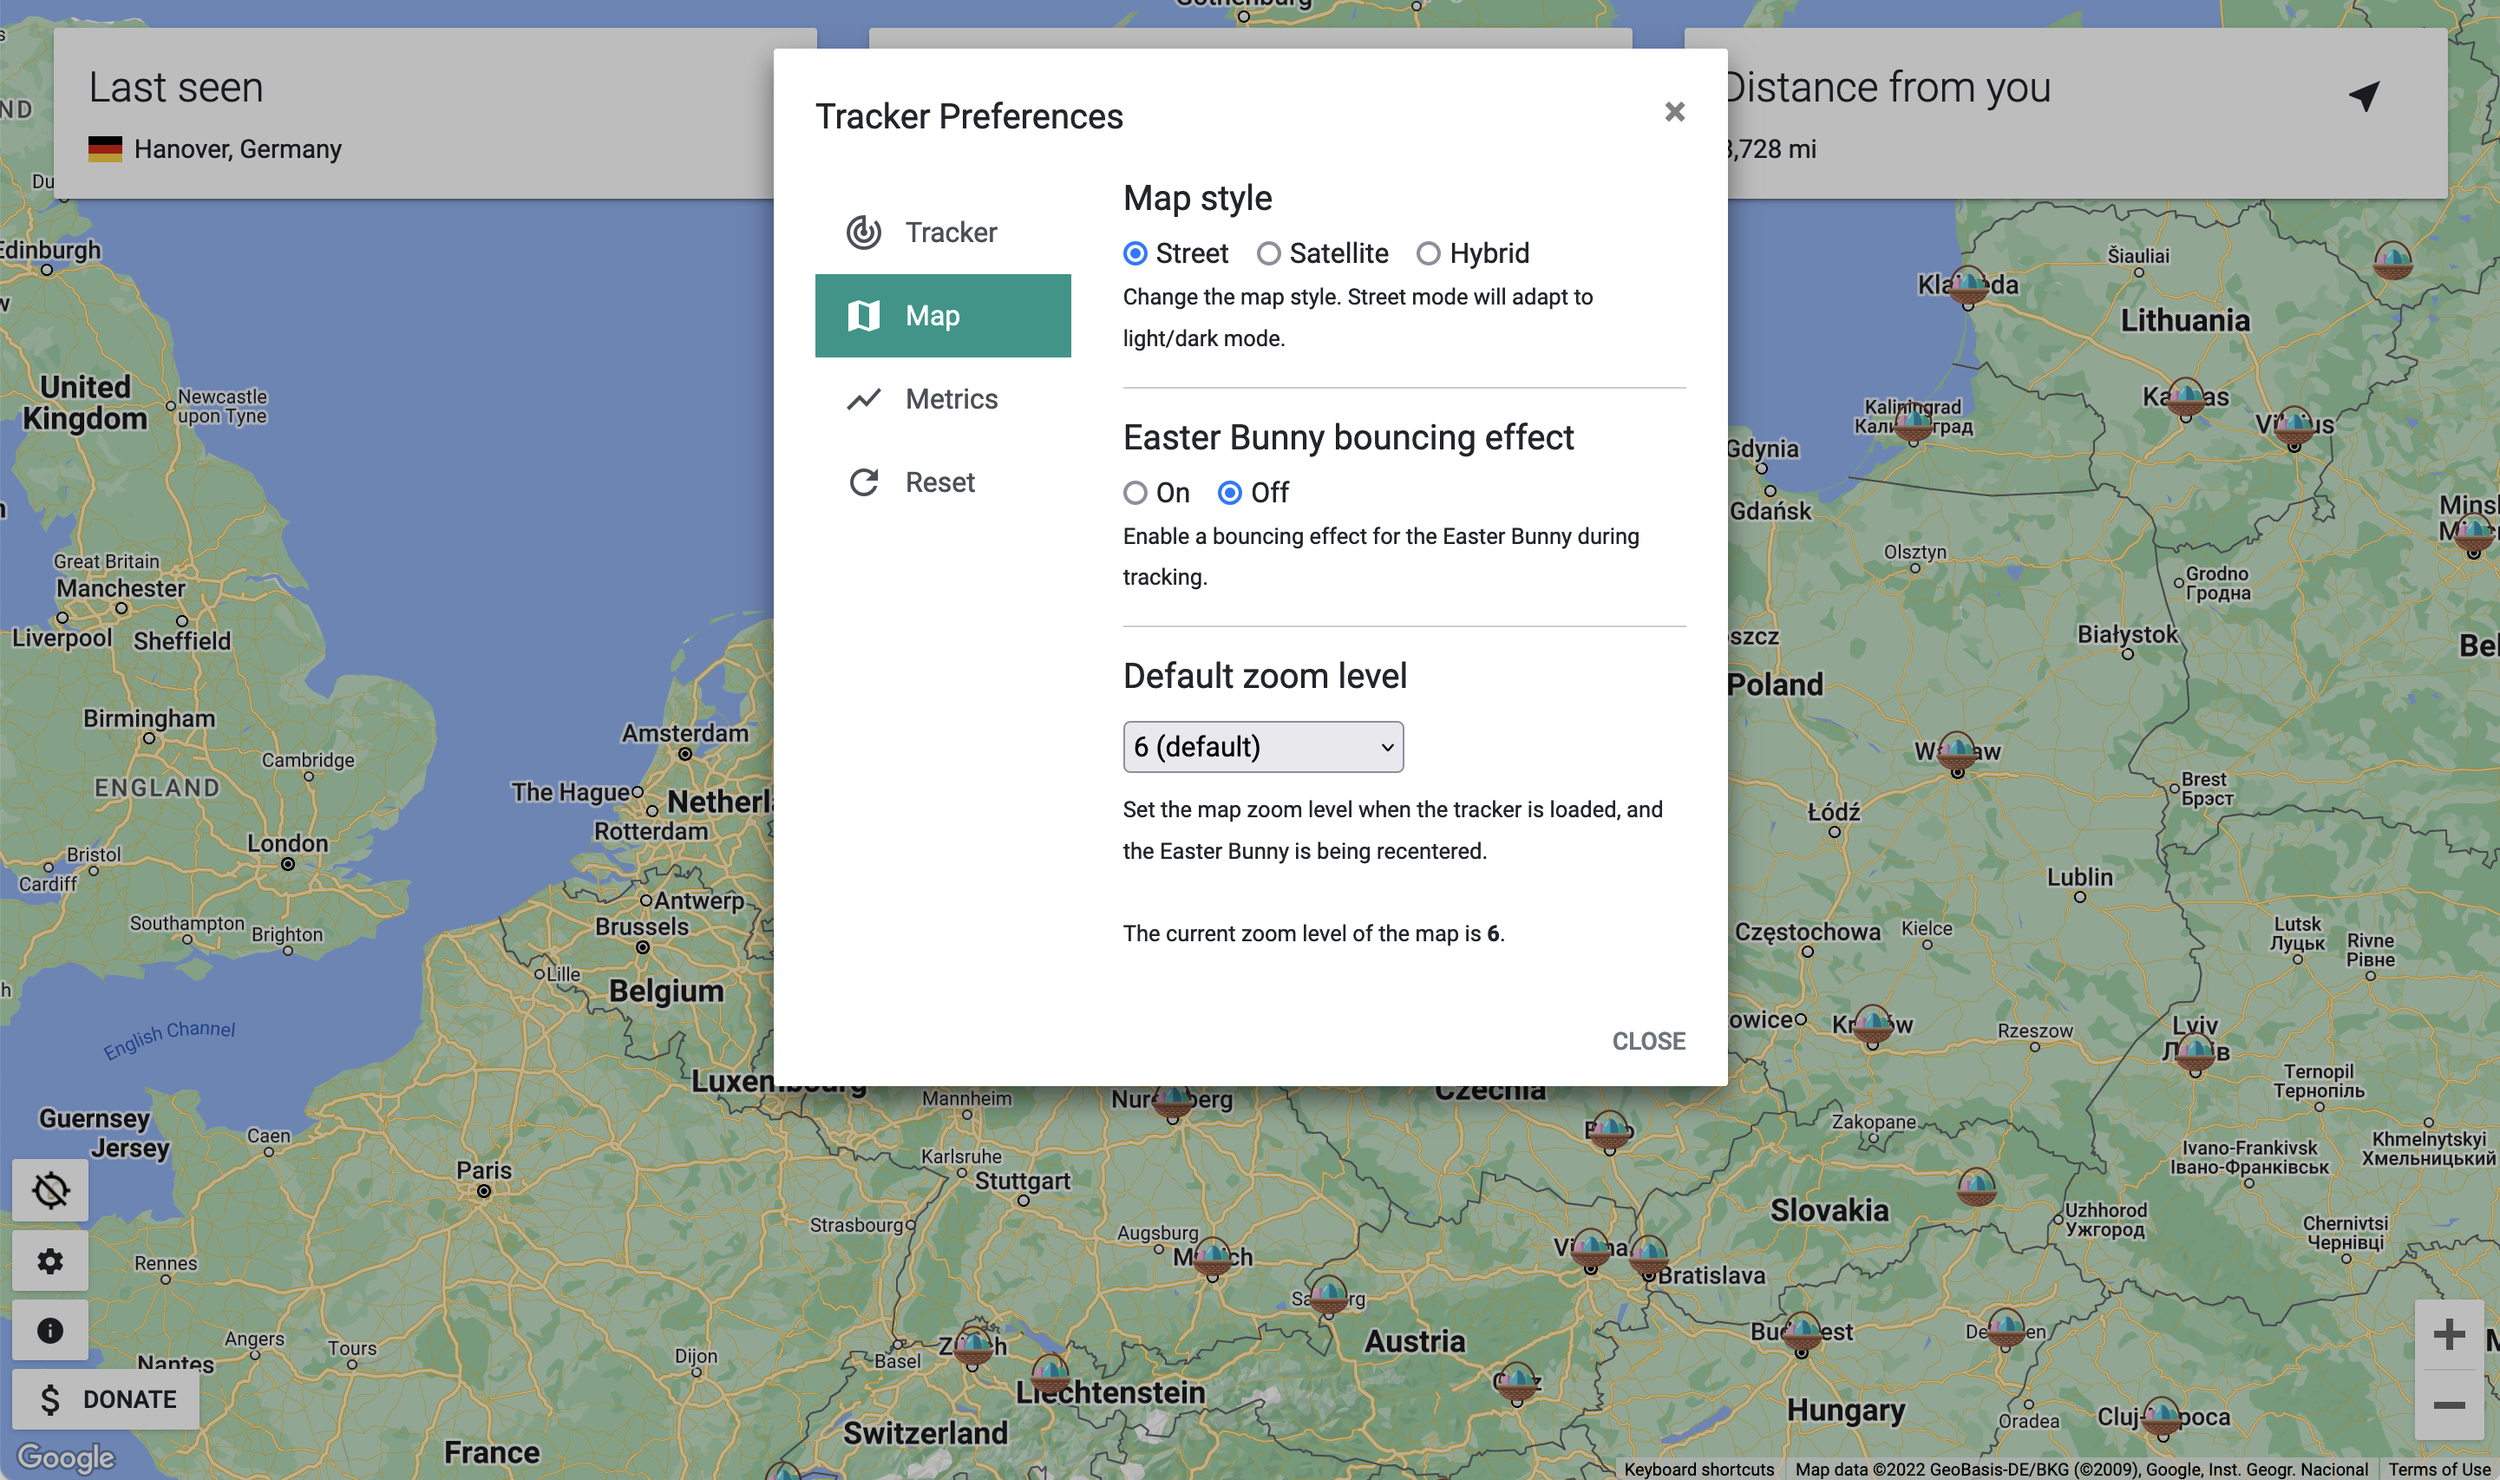
The map tab of settings has all the settings you’d need to control how the map looks. This includes if the Easter Bunny icon bounces, the map type, and even changing the default zoom level of the map!

The metrics tab controls all the metrics of the tracker - including which metric shows up, where they show up, and if certain metrics show up in the stop information window.
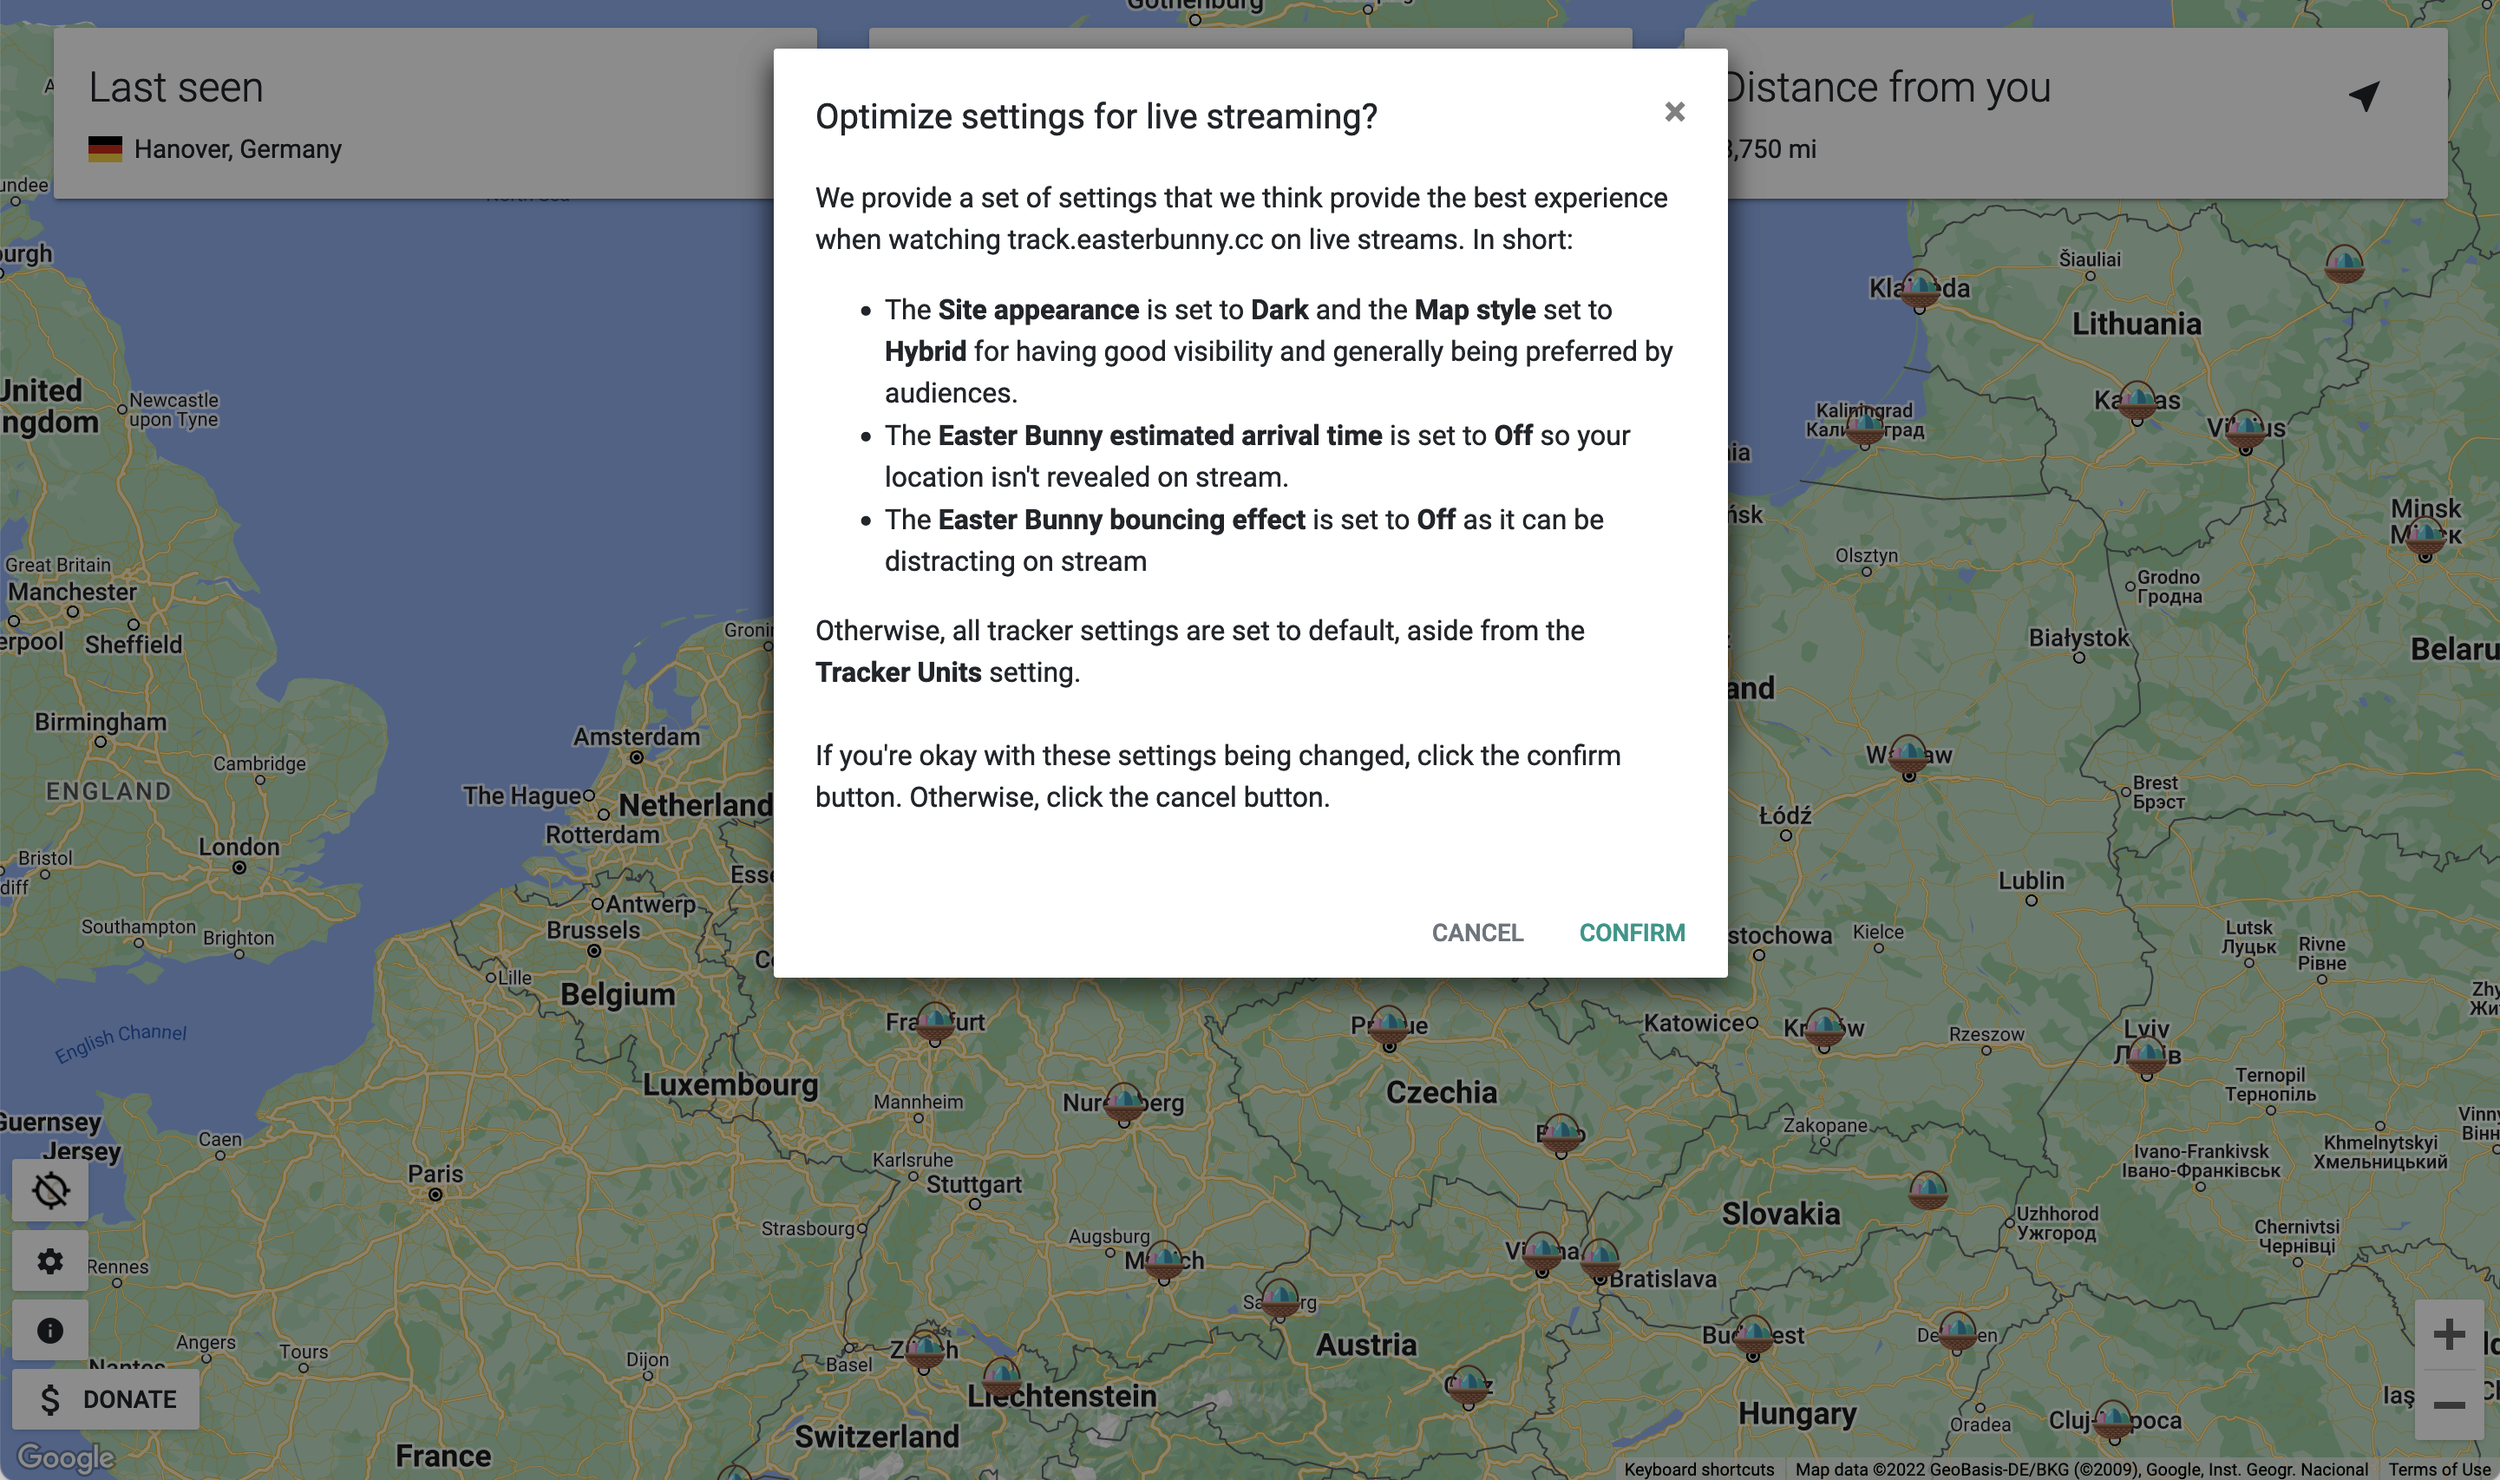
The last tab (the reset tab) does what it says. However, because a lot of people stream (and want to stream) track.easterbunny.cc, I’ve included a handy reset button to the settings that most people use on streams.
Every year, I go through all the track.easterbunny.cc streams on YouTube to see what settings most people use, and change the defaults every year. For instance, in 2022, most streams used the highest frequency of updates, so I’ll be adding that to the default streaming settings in 2023.
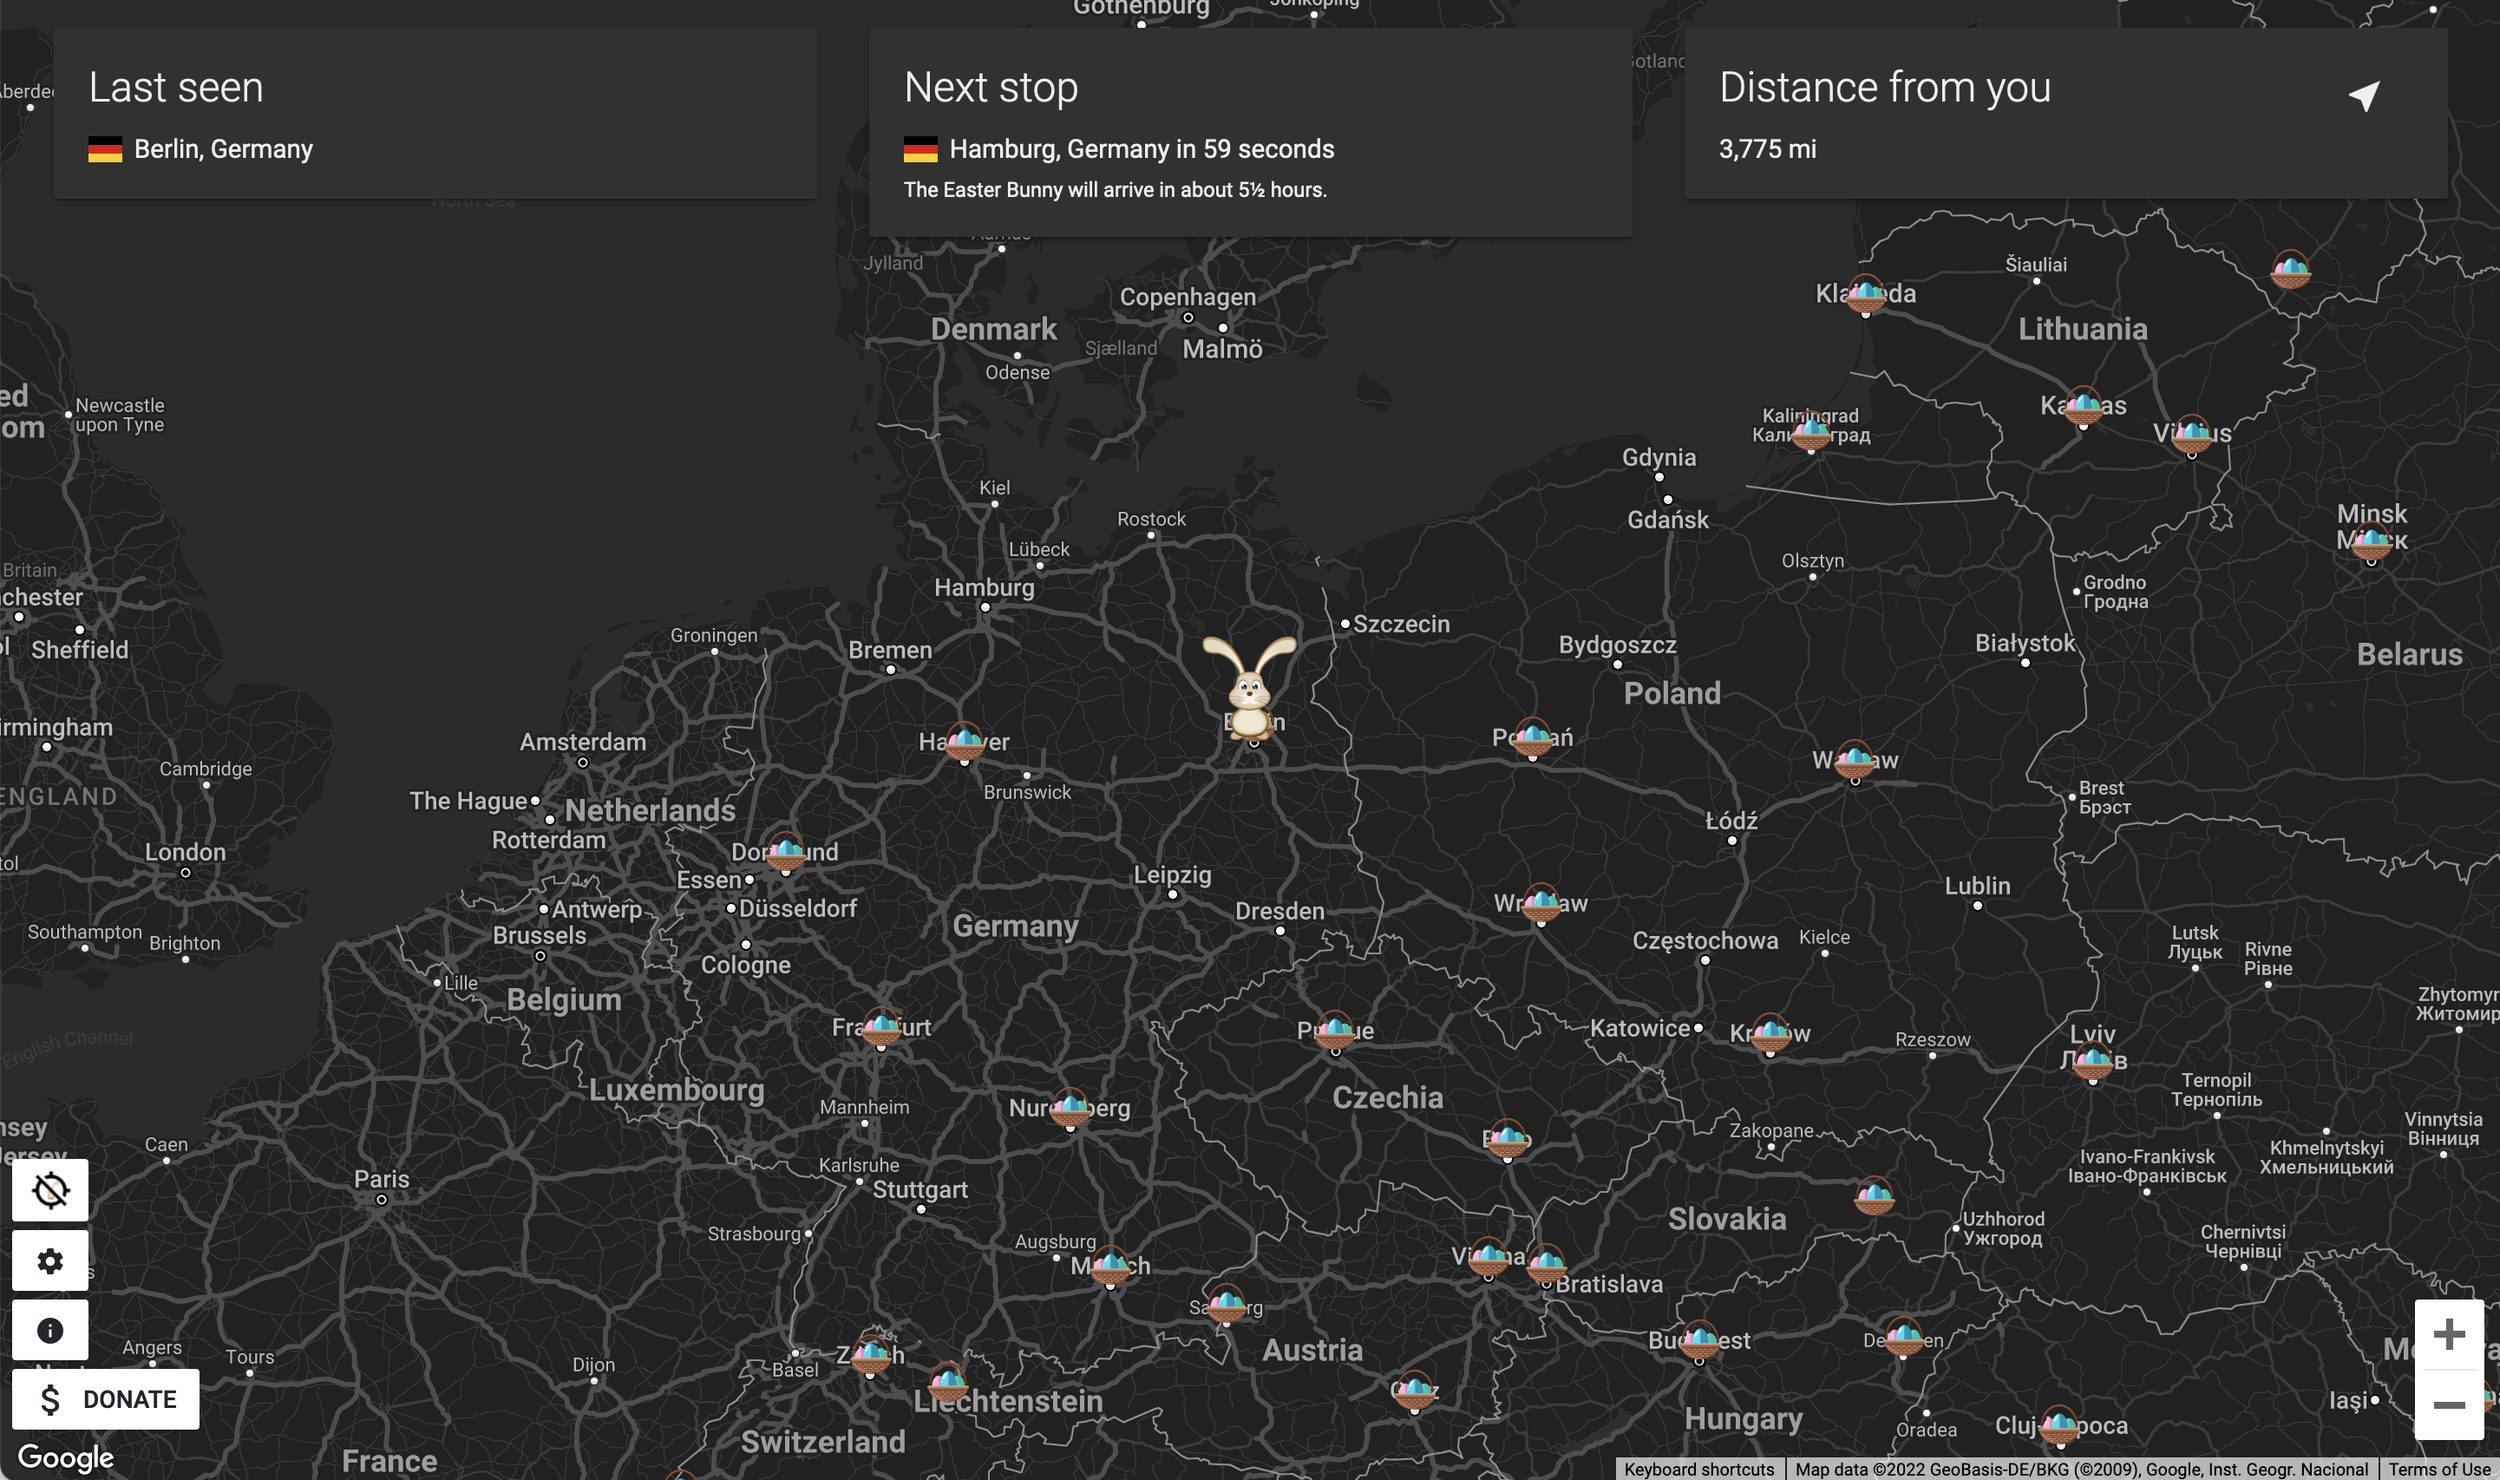
And of course, track.easterbunny.cc remains the only tracker to have a full on dark mode. The buttons remain light to provide better contrast.

track.easterbunny.cc has a catalogue of about 900 stops that the Easter Bunny visits - which is 2x to what the nearest competitor has.
For each stop, you can click on the basket icon on the map and launch the stop information window.
Inside the window, stop basics are shown - when the Easter Bunny got there (the local time arrival is a setting you have to enable), the weather, population, and elevation. A short 4 sentence description from Wikipedia is gathered so you can get a gist of the stop, and a Wikipedia link is provided to learn more.
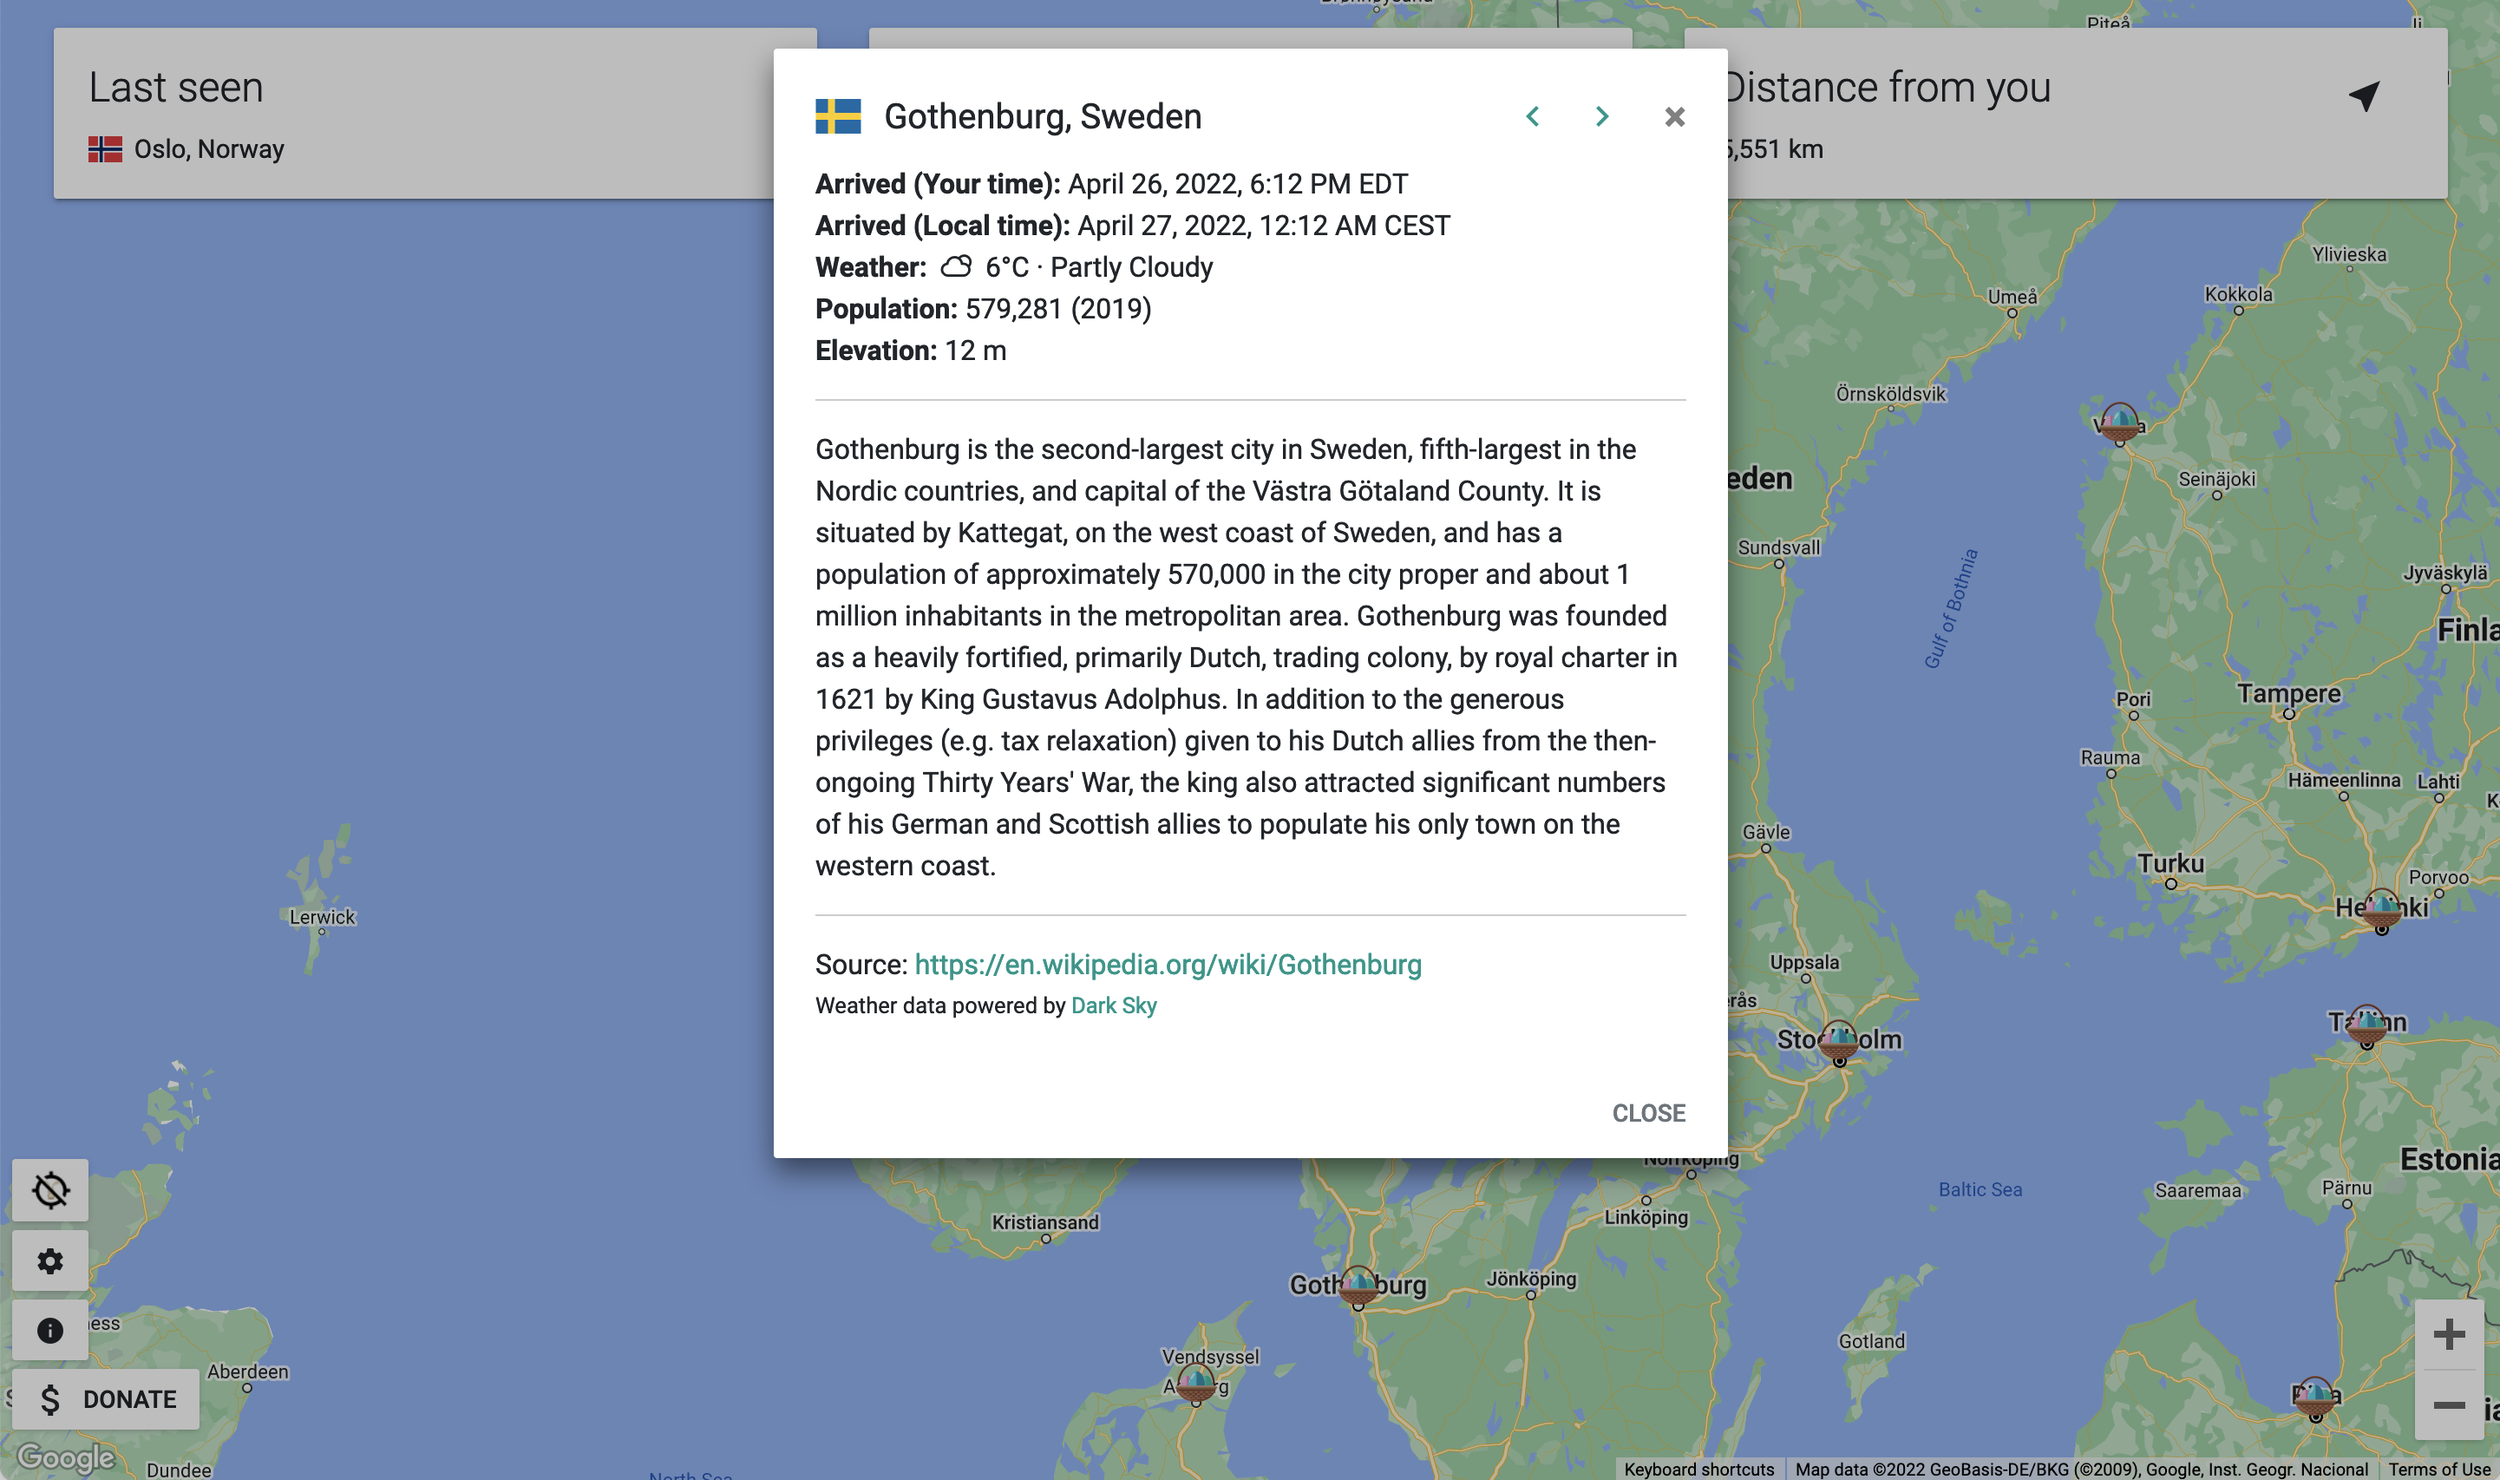
At the top right of the stop information window, there’s navigation arrows to quickly navigate through the Easter Bunny’s route.
It’s a good time to mention that this tracker also has localization for units other than American ones. The tracker will automatically (or manually via settings) localize the distance from you, speed, weather, and elevation into your preferred unit system.
Additionally, number formatting and time formatting is also localized!
The tracker is only available in English nonetheless. Translating is not a huge priority for me right now, and is very time intensive.
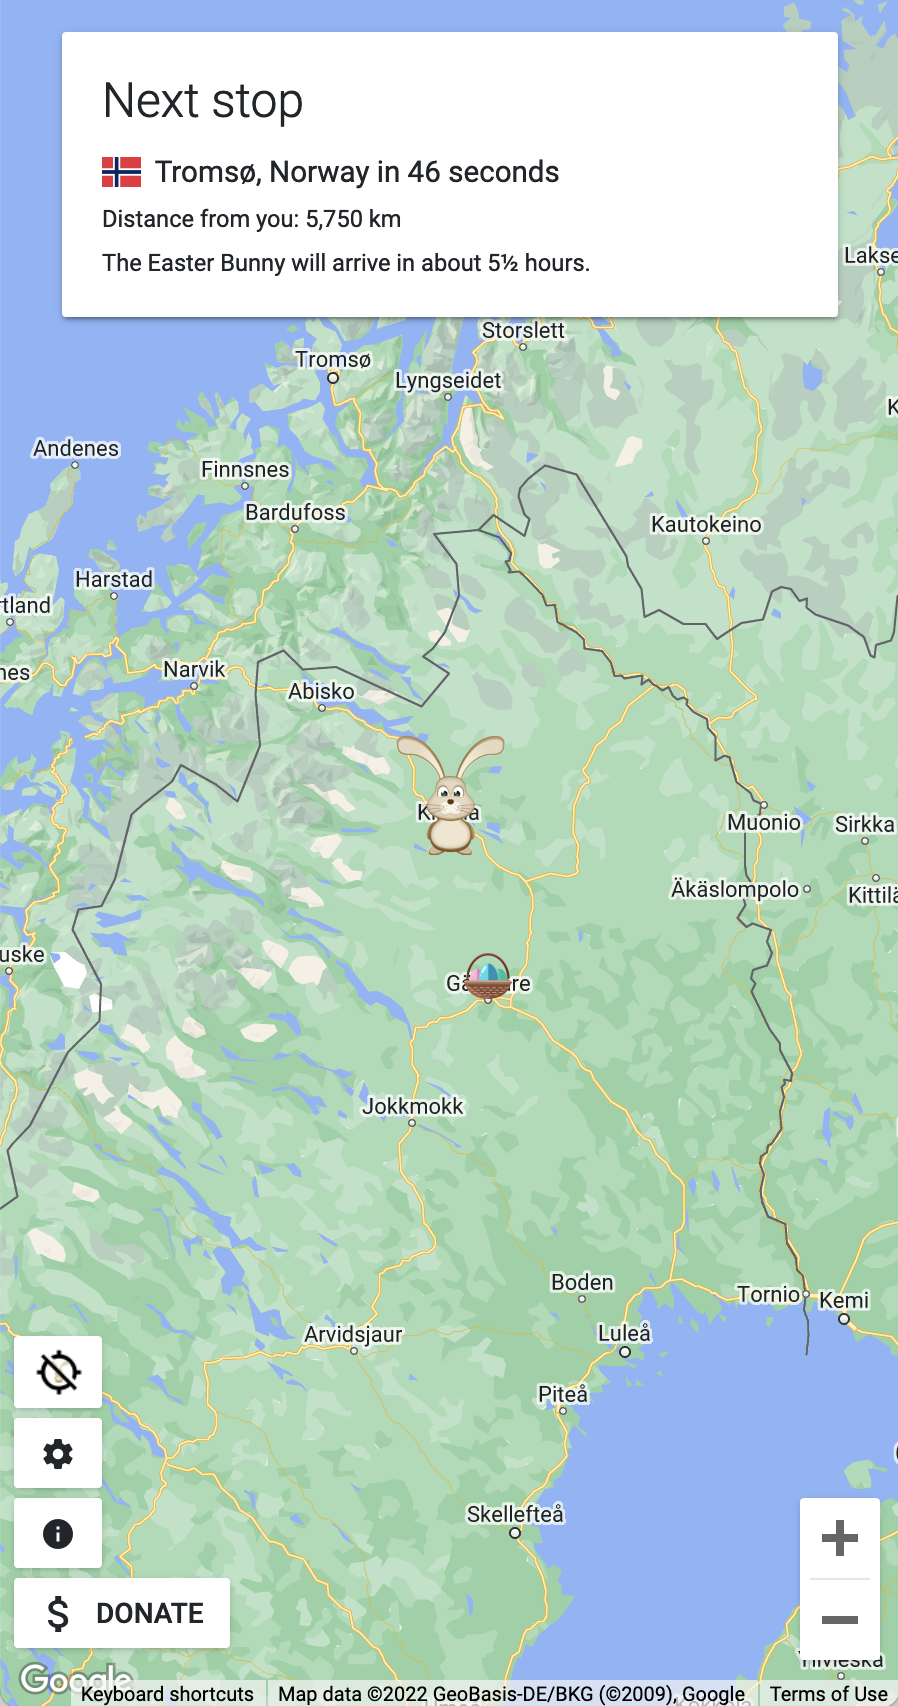
Given that mobile usage outpaced desktop usage 3-to-1 this year, I’ve continued to make sure the tracker is optimized for usage on mobile devices.
Mobile devices switch to only showing one box - but then put the metrics data as small text. And, by default, mobile devices have a default zoom level one higher than desktop for a relatively similar perspective.
The settings menu is also optimized for mobile - having the 4 different tabs at the top of the modal (instead of beside).

I also took into consideration users putting the tracker in landscape on mobile devices. Without any interventions, the Easter Bunny icon would get cut off by the top boxes when the screen height got under about 450px.
When the screen height starts to go under 500px, the Easter Bunny icon is automatically shifted down, and centered on that shifted down point. In v5.6, this system was overhauled to work on all browsers on any device, instead of just happening on orientation changes.
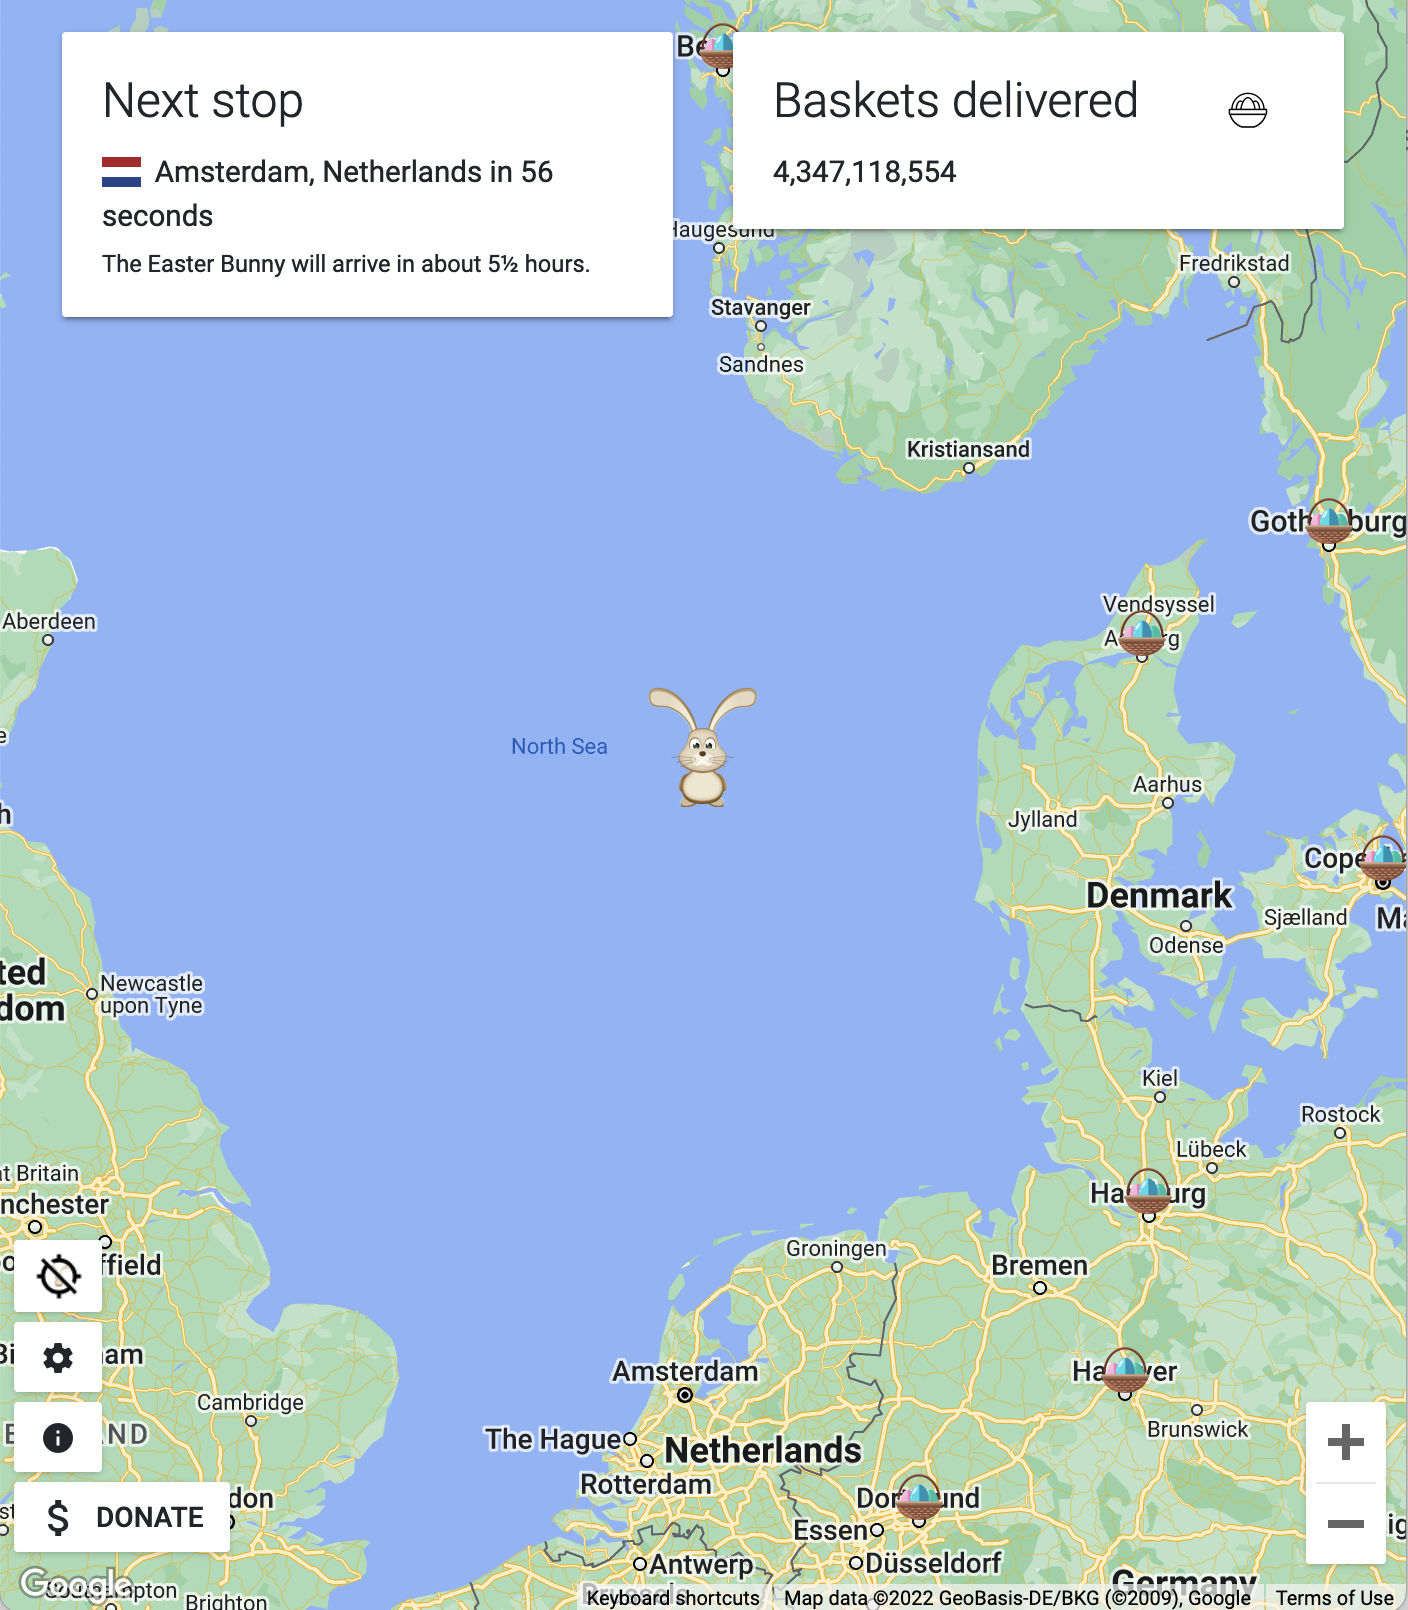
Design considerations were also made for people on tablet devices that can show two boxes. In this case, the next stop and metrics boxes are shown.
This is a change from last year, where the last seen and next stop boxes were shown with metrics in small text. I basically decided that the last seen box isn’t super helpful, and much more readable metrics was a better use of space.

Now, remember that IP location API we talked about earlier? It has a second purpose. This API is called every time the tracker is loaded to the point where JavaScript is enabled and working. In Cloudflare, it’s intentionally set up to bypass caching, so for every tracker load, my origin server gets queried once for an IP location.
What I then realized was that you could make a pretty nifty hit counter out of this. So, for every call during tracking, it’ll atomically increment a hit counter on the disk. That’s it. Very simple.
From that, I then built the custom TEBCC Hit Insights, which was basically a real-time hit counter to see how the tracker was doing in terms of hits.
It starts with the hit counter updated every 20 seconds in the top left. Then, metrics on hits in the last hour (including hour-over-hour change), hits per minute/second, and the estimated Google Maps API cost are shown.
Last but not least, because I am Owen, there’s graphs. There’s always gotta be graphs.
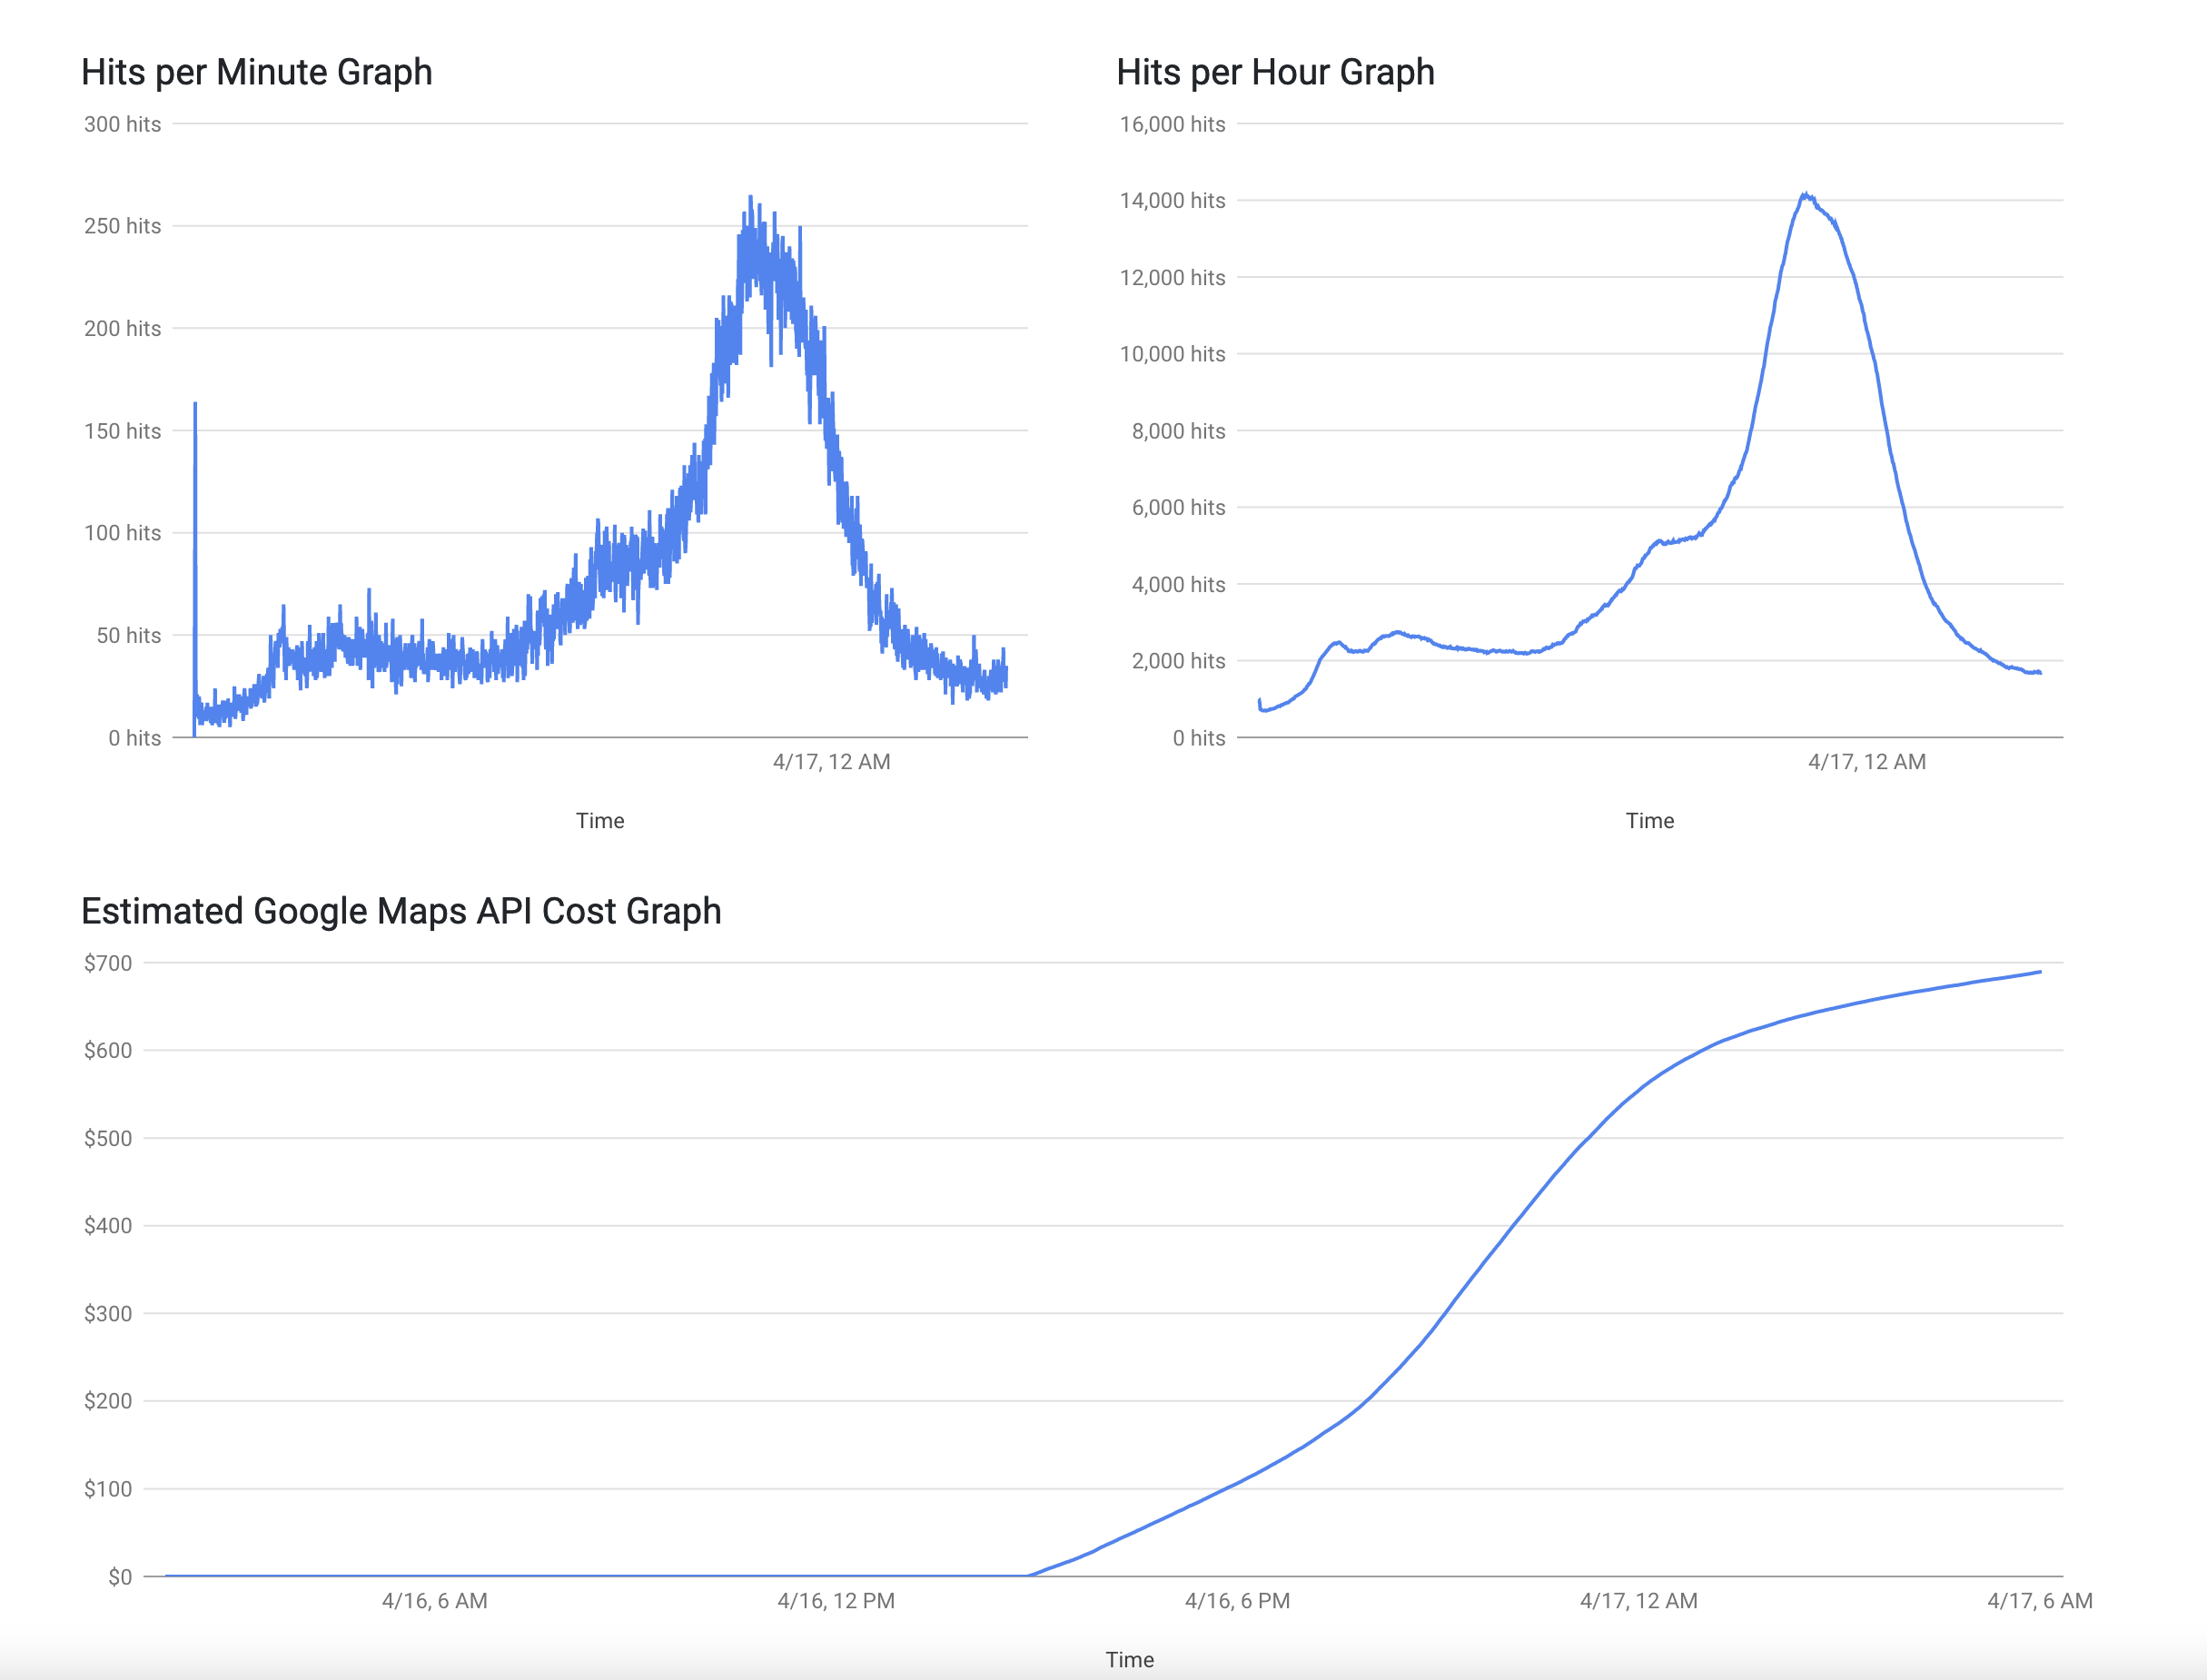
Graphs further down the page show the hits per minute and hits per hour.
Data for these graphs is collected by calling the API every minute to get the latest hit count, logging that hit count, therefore creating historical data. With that historical data, the client-side performs calculations for all the extra data.
To maintain the atomic incrementing, I needed to call the API instead of opening the file manually to ensure the hit count didn’t change while we were reading it. All API methods that dealt with the hit counter & historical hit counter data had locks to prevent race conditions.
I actually had to implement locks, as at the start of tracking, there were about 200 users hitting the server in about 5 seconds, so there was the real chance there could be race conditions. Otherwise, the tracker was loaded every ~226ms at peak, so locks weren’t REALLY needed (the open/increment/save operation takes 10ms or less).
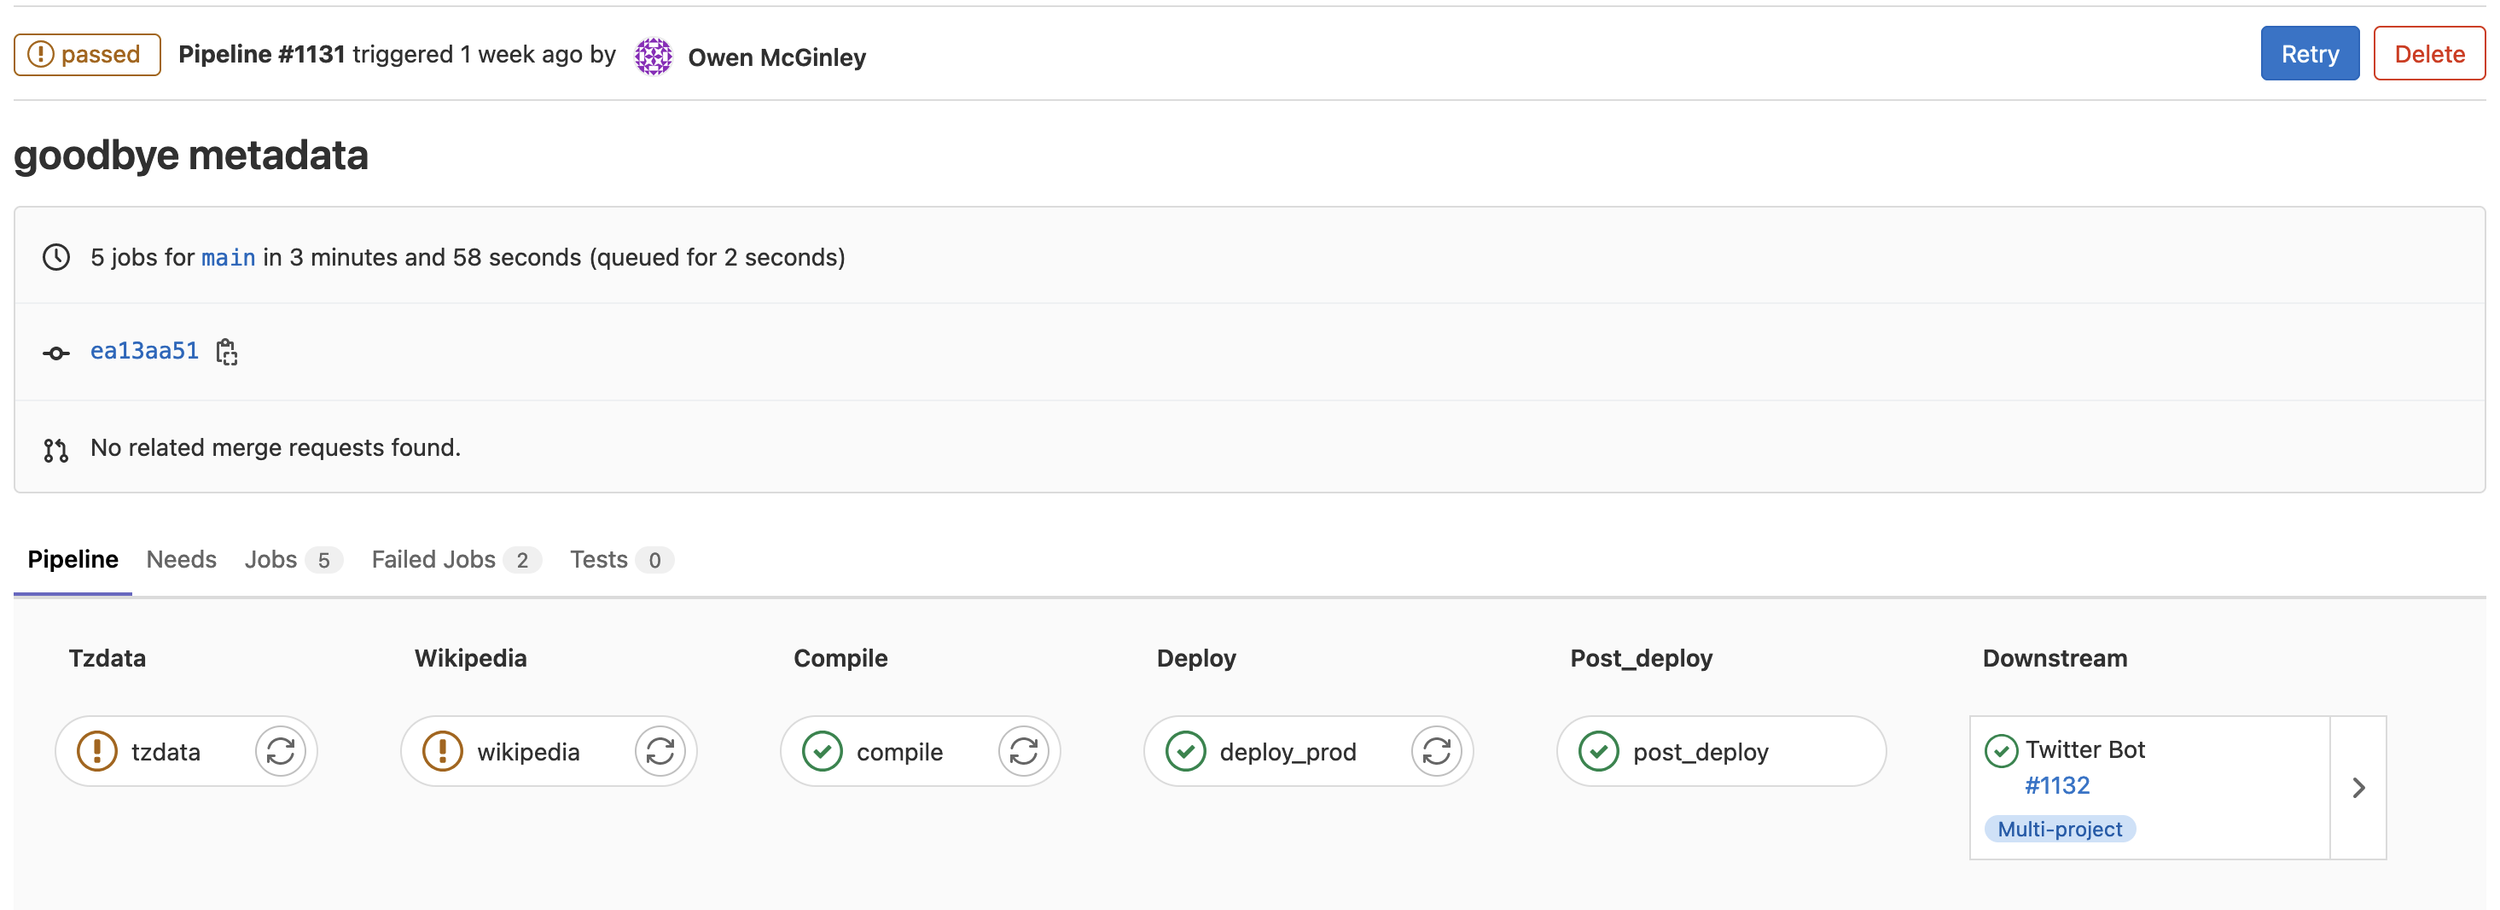
Behind the scenes, track.easterbunny.cc made extensive use of GitLab CI Pipelines to make the entire development process streamlined.
Website deployments were all controlled via GitLab CIs that used SFTP upload to the web server.
The route compiler entirely sat behind a relatively complex CI pipeline with 5 stages. Each stage of the compilation process can be enabled/disabled with a configuration file, in addition to other options. Having scheduled pipelines to compile the route right before tracking was a huge help.
And that’s track.easterbunny.cc, more specifically, Version 5.6. It’s a very cool project that’s quite diverse in what to do, and I continue to have tons of fun with it.
After this year with 127,000 hits, track.easterbunny.cc has now received a combined 268,000 hits during the 112 hours of tracking in the last 4 years. Add up the post-tracking periods, and that count is easily over 300,000 hits.
At this point, you should take a look at the articles for v3/v4/v5! They’ll all show the iterations in design, and go more into how certain features are implemented.