track.easterbunny.cc (Version 5)
track.easterbunny.cc Version 5 refined an already groundbreaking Easter Bunny Tracker, with lots of little features for a more complete tracking experience.
Version 5 included new features - additional metrics, mobile metrics, better localization, more stops, and better consistency in stop data.
Combining the extra improvements and larger fanbase from last year, track.easterbunny.cc achieved over 100,000 hits in 28 hours of tracking. What was a tiny project just two years ago had morphed into my most popular project yet.
—
Lines of code: ~15,000
Languages: HTML, CSS, JavaScript, Python
Frameworks: jQuery, Material Design Bootstrap, Flask
Timeframe: May 2020 - April 2021 (track.easterbunny.cc remains under active development, this is the specific timeframe when v5 was coded)
—
You can visit this project at track.easterbunny.cc.

track.easterbunny.cc Version 5 virtually looks the same from Version 4. I continued to use Material Design Bootstrap 4 for the lightweight design.
The main controls of the tracker are in the bottom left in a vertical stack - the order the same from last year.
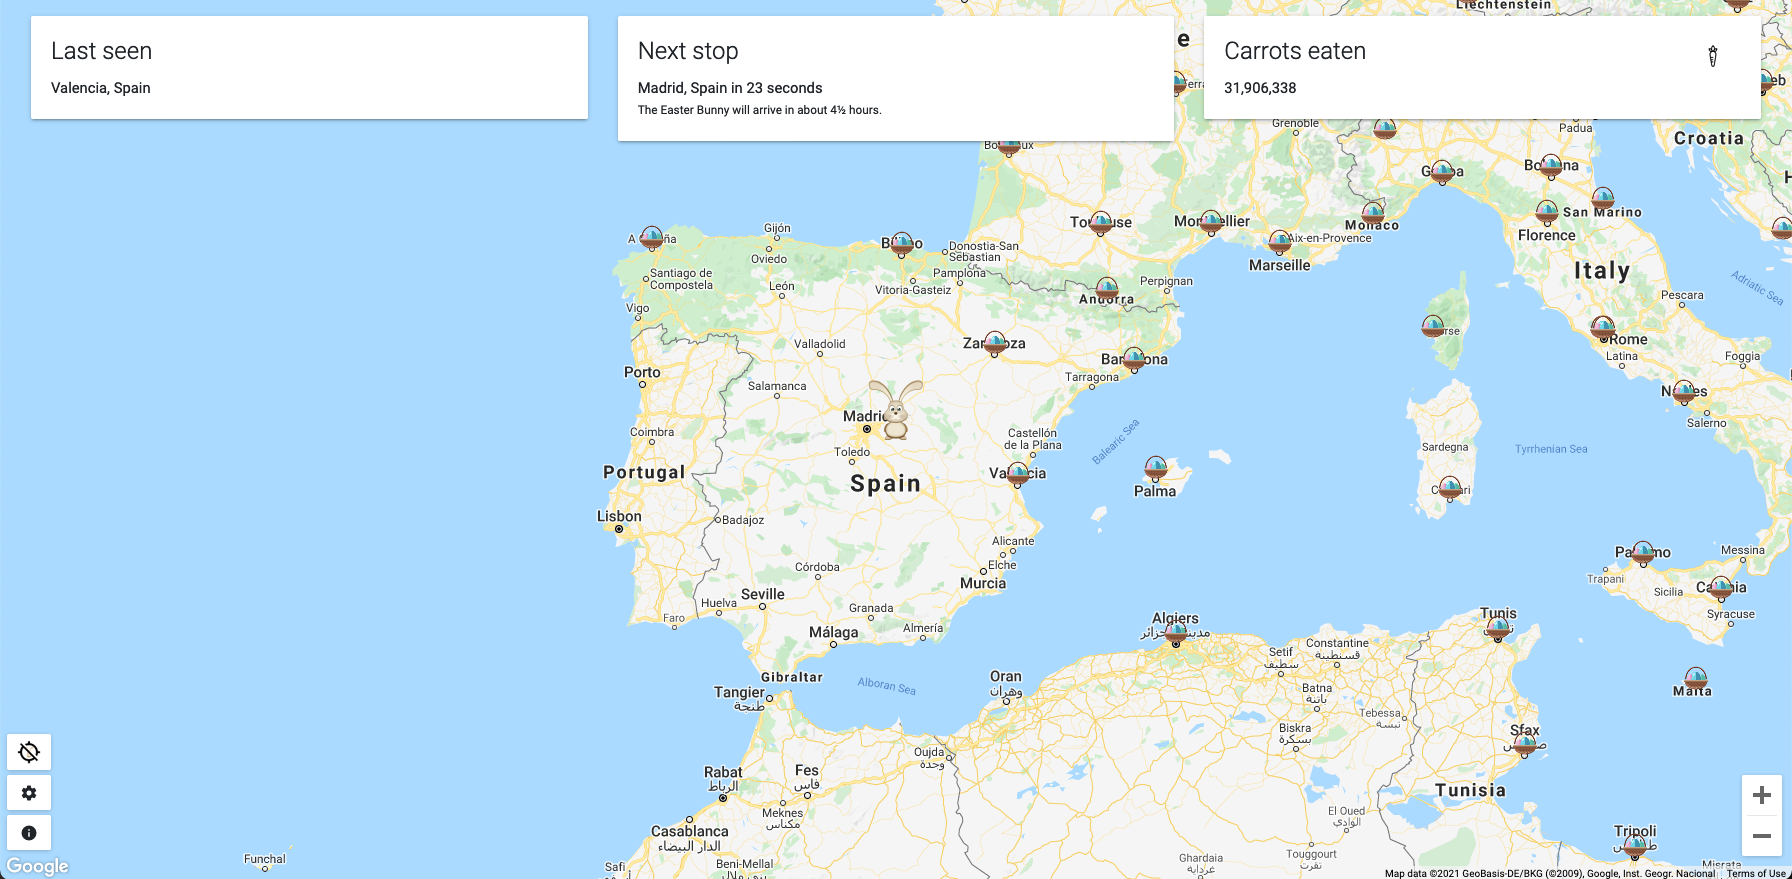
The only change was the addition of a button in the right-most box. This allows you to change the metric displayed during tracking, with five metrics to choose from.
The first (and default) metric is baskets delivered. The baskets delivered metric got a nice overhaul from v4, being directly influenced by the population of the stops. This meant the baskets delivered metric was super accurate.

The second metric here is carrots eaten - basically the baskets delivered count divided by ~125, with some variation so it’s not a direct ratio.

The third metric up is distance traveled. I had to do some localization efforts here, as it’s distance traveled in the US, but distance travelled outside of the US.

Speed is the fourth metric. This was truly accurate, using the Haversine formula to get distance between two stops. I added in a random +/- 0.01% variation every 250ms, just so the speed meter was changing a bit here and there.

Distance from you is the final metric.
A users’ location is determined by their IP location, as that’s good enough for the arrival estimate. For distance from you, this gets a bit trickier.
MaxMind (the database I use) has an accuracy rating, so the metric displays “Under x km/mi” when the Easter Bunny is within the accuracy rating of the IP location, multiplied by 5.
So, if my IP location accuracy is 20km, the metric would display “Under 100 km” when the EB is <100 km from my determined IP location. It’s a clever solution to avoid inaccuracies in this methodology.

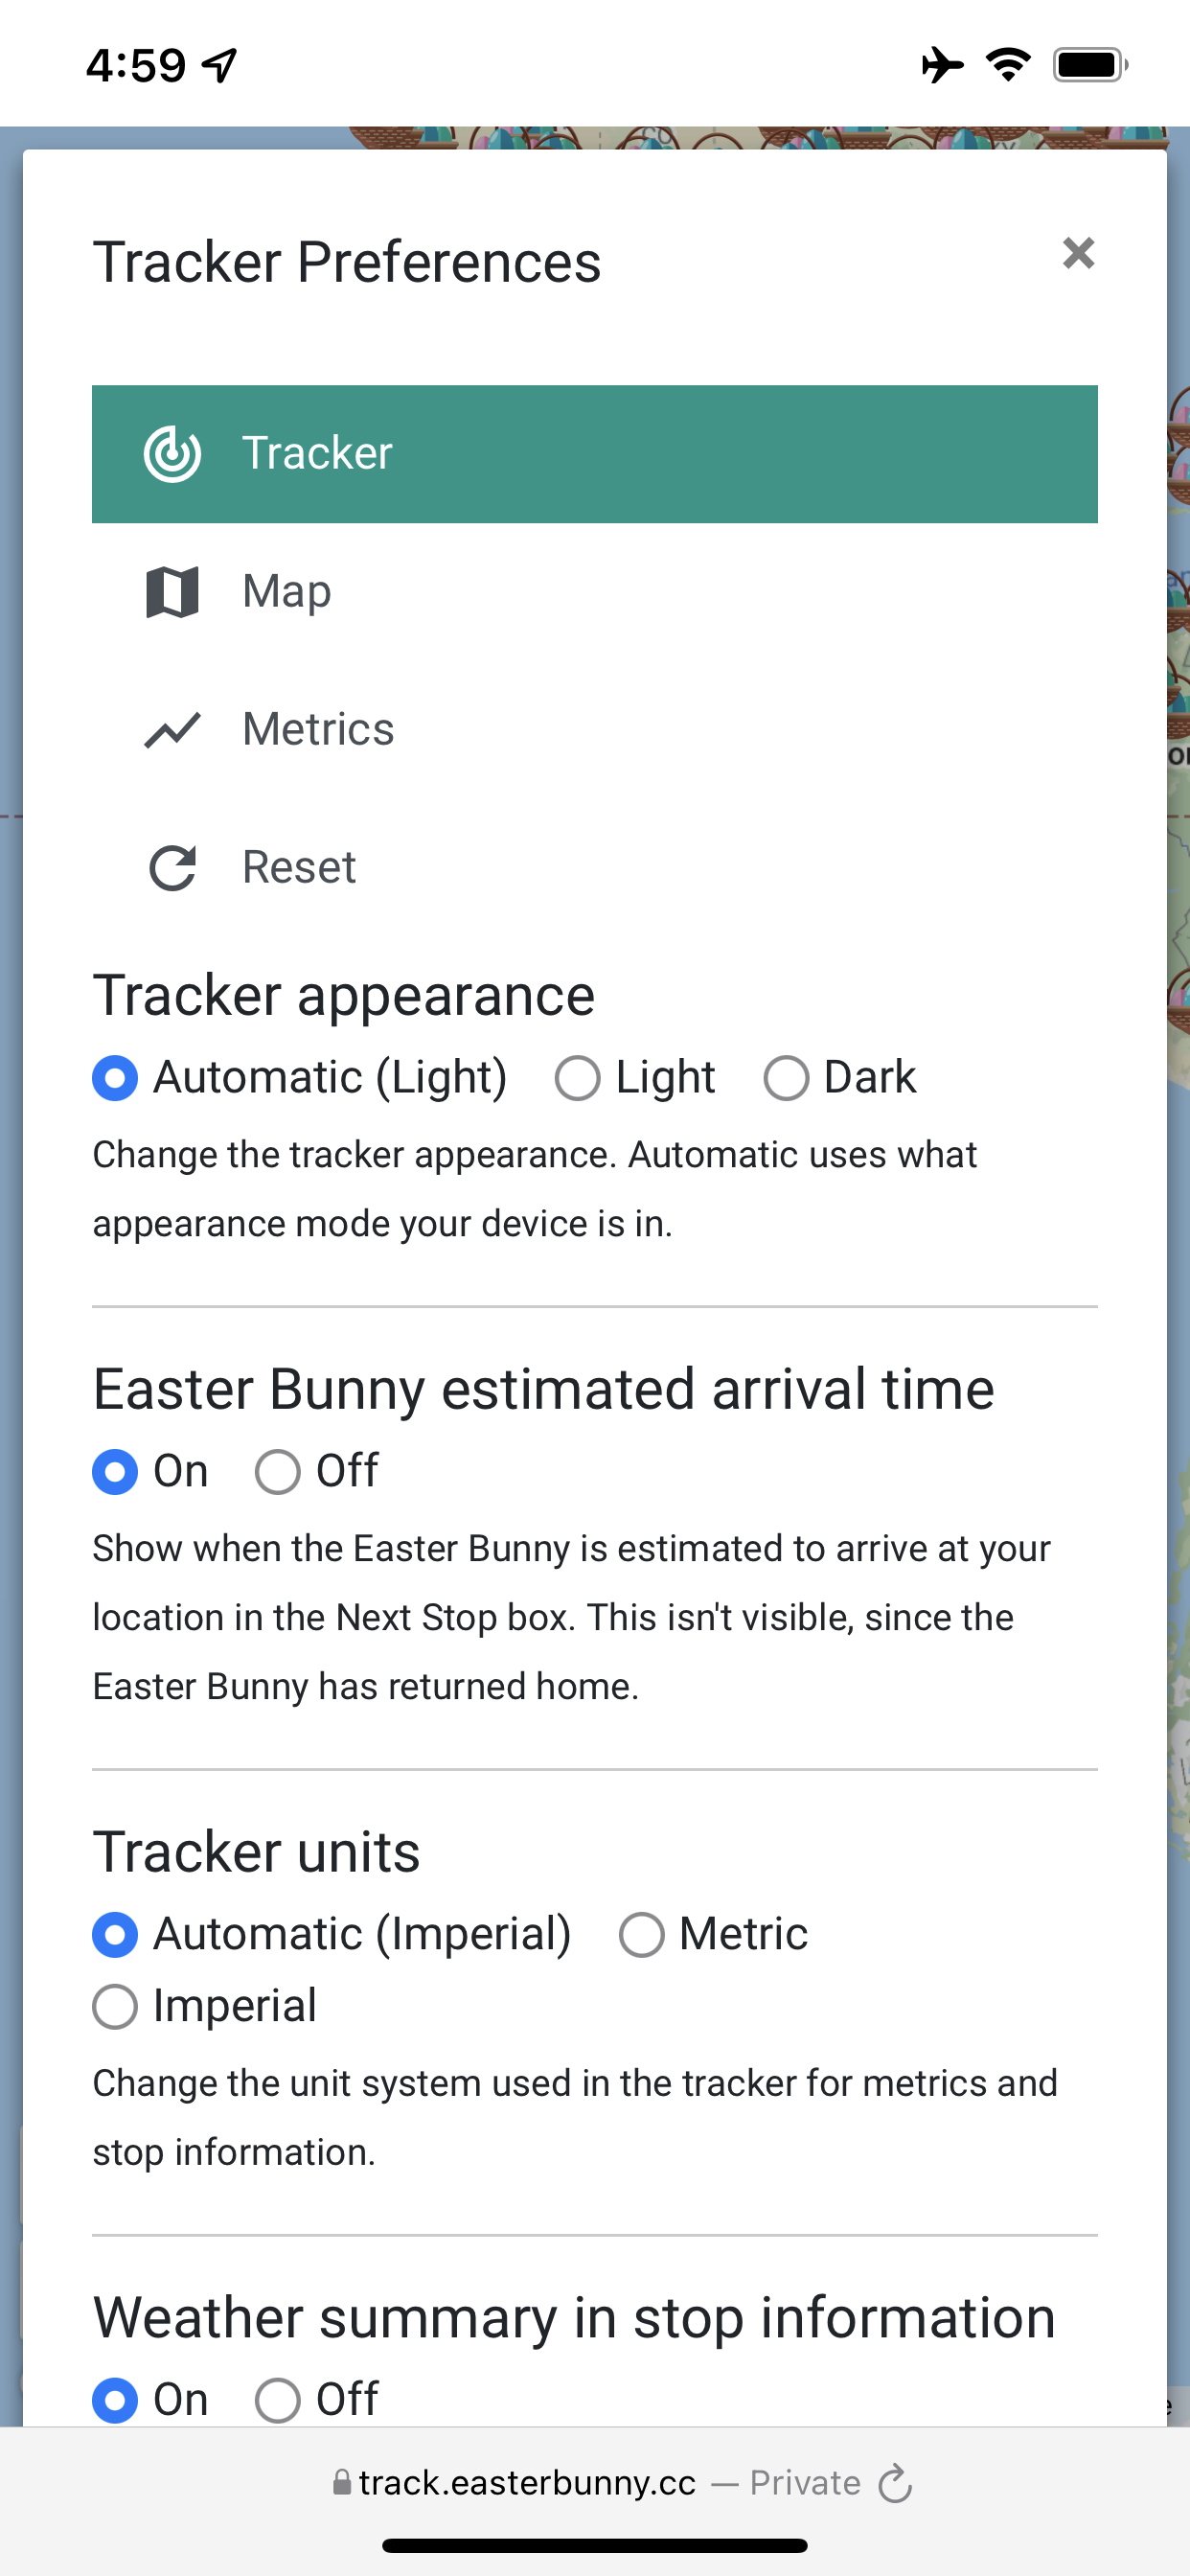
The settings page got a major rework compared to Version 4. On the left, iconography and shorter text defines each section. Additionally, I cut down on excess text in the descriptions for each setting.
Otherwise, there’s some extra settings to reflect changes made from v4 to v5.

The map settings have some additional options from last year. The default zoom level is now customizable when the tracker loads. On Chrome, an option to reduce the grey lines in the map (due to page zoom) is also available - at the expense of the zoom buttons disappearing.

The Metrics tab is new for Version 5. It contains two settings - one for changing the metric displayed (this is how it’s changed on mobile devices - the button isn’t visible), and if metrics should be displayed in the last seen/next stop boxes on smaller devices.

The reset section is identical to Version 4. However, the modals presented to the user were changed, and are more descriptive about what’s changing.
I also updated the optimized stream settings to reflect what people used on their streams for v4.

Here’s what the settings page looks like on mobile devices. The iconography really helps in these situations.

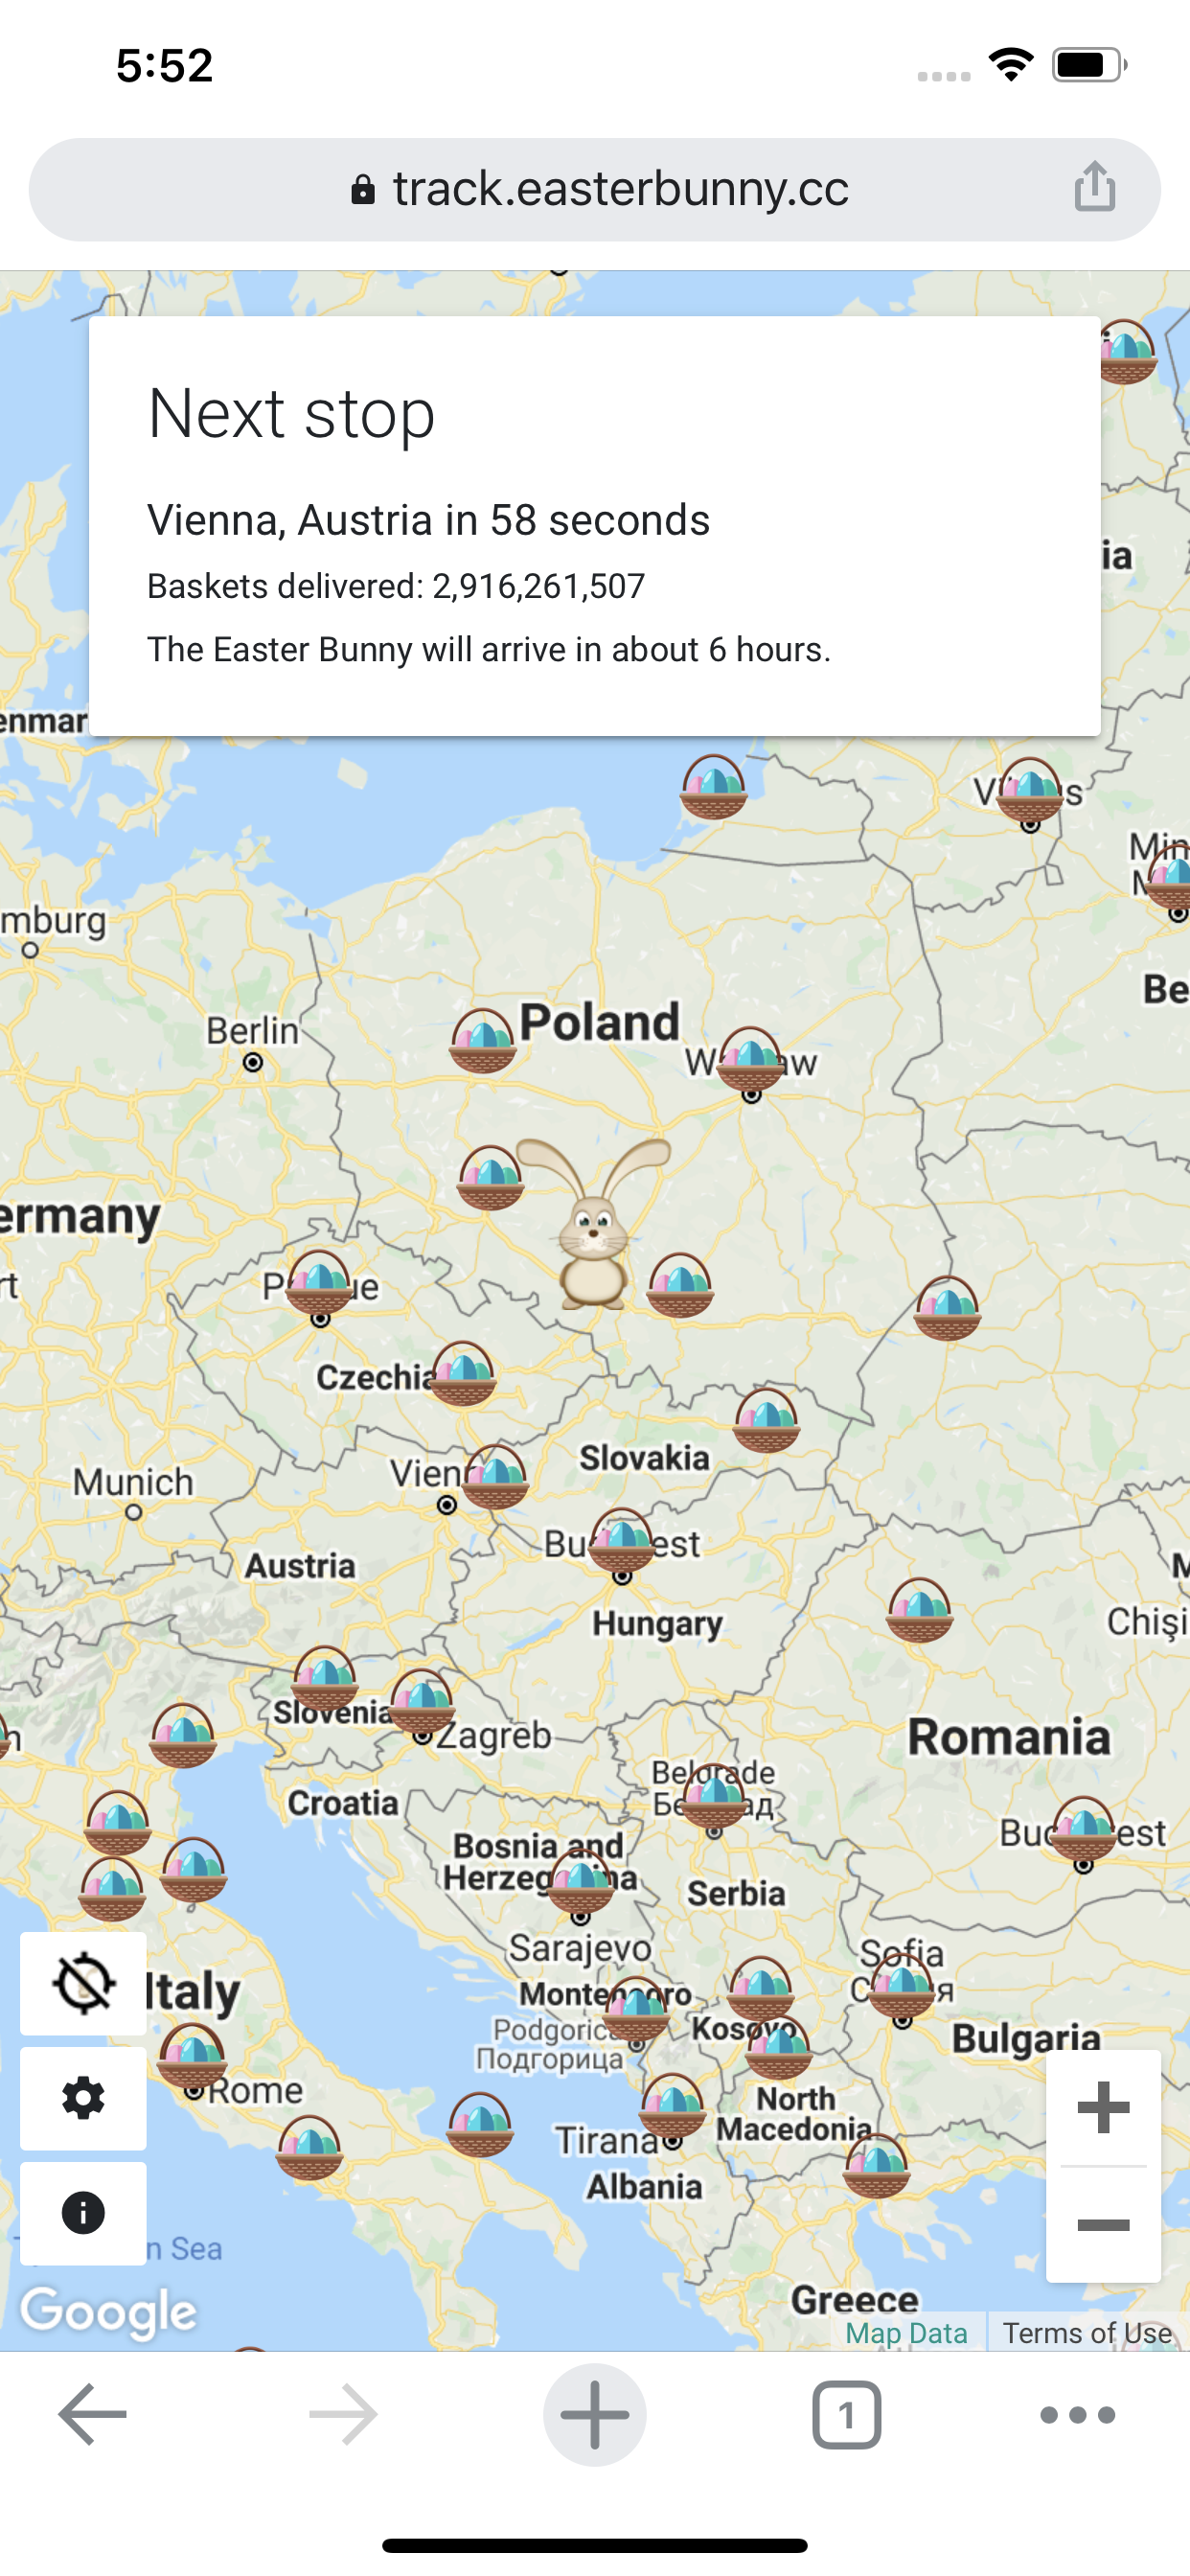
Here’s what metrics on mobile look like. It goes above the Easter Bunny arrival text.
There’s no point in having a button to do easy switching, as the tap target would be ridiculously small. As such, the metrics section is necessary in settings.

The estimated arrival time feature got some updates. Similar to last year, it decrements in half-hour steps, going to 1 hour out.
After that, it decrements in 15-minute steps, going to 30 minutes out.
Once that threshold has been passed, it updates to “The Easter Bunny will arrive shortly!”.

The most notable change is that the text now goes to “The Easter Bunny has arrived in your area!” when the Easter Bunny is +/- 10 minutes from a users nearest stop. In v4, “The Easter Bunny will arrive shortly!” text disappeared after reaching that nearest stop.
Especially with the increased number of stops in v5, this helped ensure that “The Easter Bunny will arrive shortly!” text didn’t disappear prematurely or too late, and instead, just approximated that the EB arrived in your area.

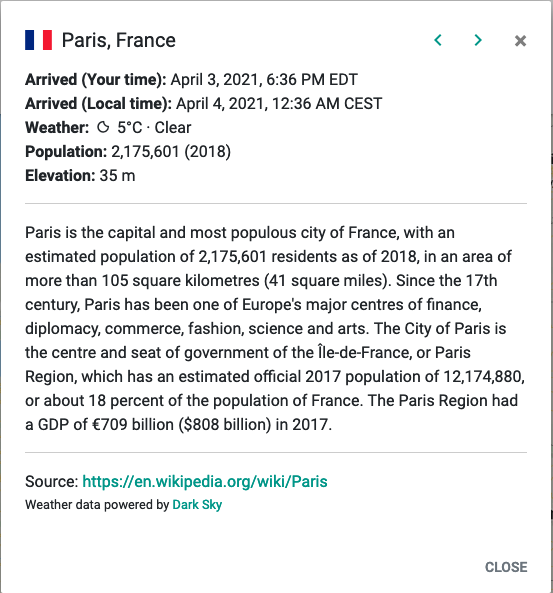
The ESD (Extended Stop Data) system got a nice update in v5. I added navigation arrows to the top on larger devices, so a user could easily navigate between stops.
Having an excerpt from Wikipedia was a great addition in v4, but I manually did all the work. This meant that the length of that excerpt could vary widely!
In v5, I made a script to grab the excerpt automatically, using Regex filtering to get rid of pronunciations (with a ~99% accuracy rate), then a manual pass from me, before going through the route compiler to remove attribution text ([1], [2], etc).
Finally, the weather and elevation data is localized. In this example, it’s in Fahrenheit.

In this example, now the data is in Celsius. Localization is entirely configurable in settings, allowing you to change between the imperial and metric unit systems easily.
A half-baked feature from v4 makes its appearance in v5 - local arrival times. In v4, you could hover over the arrival time with a mouse to get the local arrival time, but it’s on display in v5 (configurable by settings).
Moment.JS is used for all the time formatting stuff.

The localization affects other parts of the tracker too. The distance from you, distance traveled, and speed metrics all adapt to the imperial/metric unit systems. In this example, distance from you is in metric.

Although the tracker remains in English (and will stay that way for a while), I used Moment.JS to localize time formatting to a user’s region. This screenshot is from an iPad in the UK, so you can see the UK time format.
This screenshot was taken early on in v5 development, so many changes to the stop information window weren’t implemented yet.

And that’s been track.easterbunny.cc Version 5! For the third year of operation, it was wildly successful, even though my wallet didn’t enjoy the map bill ($600 a lot given I’m a solo developer, and that no ads were running on the site!)
For Version 6, I’m planning on refactoring the tracker - as it’s quite the spaghetti mess! New features are on the table too, and looking into monetization to recoup some of the map costs.