


Beacon Hill Weather (also known as PyWeather 4 internally to keep up with the PyWeather naming scheme) is a solar-powered weather station that I’ve been building since May 2024. It is my most ambitious project from a software and hardware perspective, combining 4 software stacks and countless hardware iterations to complete.
The premise is relatively simple - I’ve always wanted a weather station since I was a kid, but now as an adult engineer, I wanted to challenge myself to build one, piece by piece, instead of buying one off the shelf.
Beacon Hill Weather had to some extra challenges too - it needed to be entirely solar-powered (no reliable wired power on my roof), and communicate on Sub-GHz radio (2.4 GHz Wi-Fi isn’t reliable in a dense urban environment). It had to be entirely waterproof, but also New England weather-proof (it can call for single digit temperatures with heavy snow in January, but 95+ degree days in the summer).
Throughout the last year and a half, I slowly pieced together all the hardware necessary to make the weather station, along with a receiver for data, a backend API to ingest & serve data, and a website to show the data to the world. I also had to make a fault-tolerant software stack on the weather station, as you can’t debug a weather station when it’s pouring rain outside! Most of the weather station was complete by March 2025.
In mid-2025, I challenged myself to add one more data point to the weather station - an automatic snowfall counter, requiring months of design, prototyping, software implementation, and calibration.
All of this combined into my best project to date, and something I’m incredibly proud of.
—
Timeframe: May 2024 - Present
Languages/Frameworks: Python, FastAPI, Pydantic, SQLAlchemy, SQLite, MariaDB, Apple WeatherKit, React, MUI
—
You can check the latest weather at https://weather.owenthe.dev (URL is clickable)!
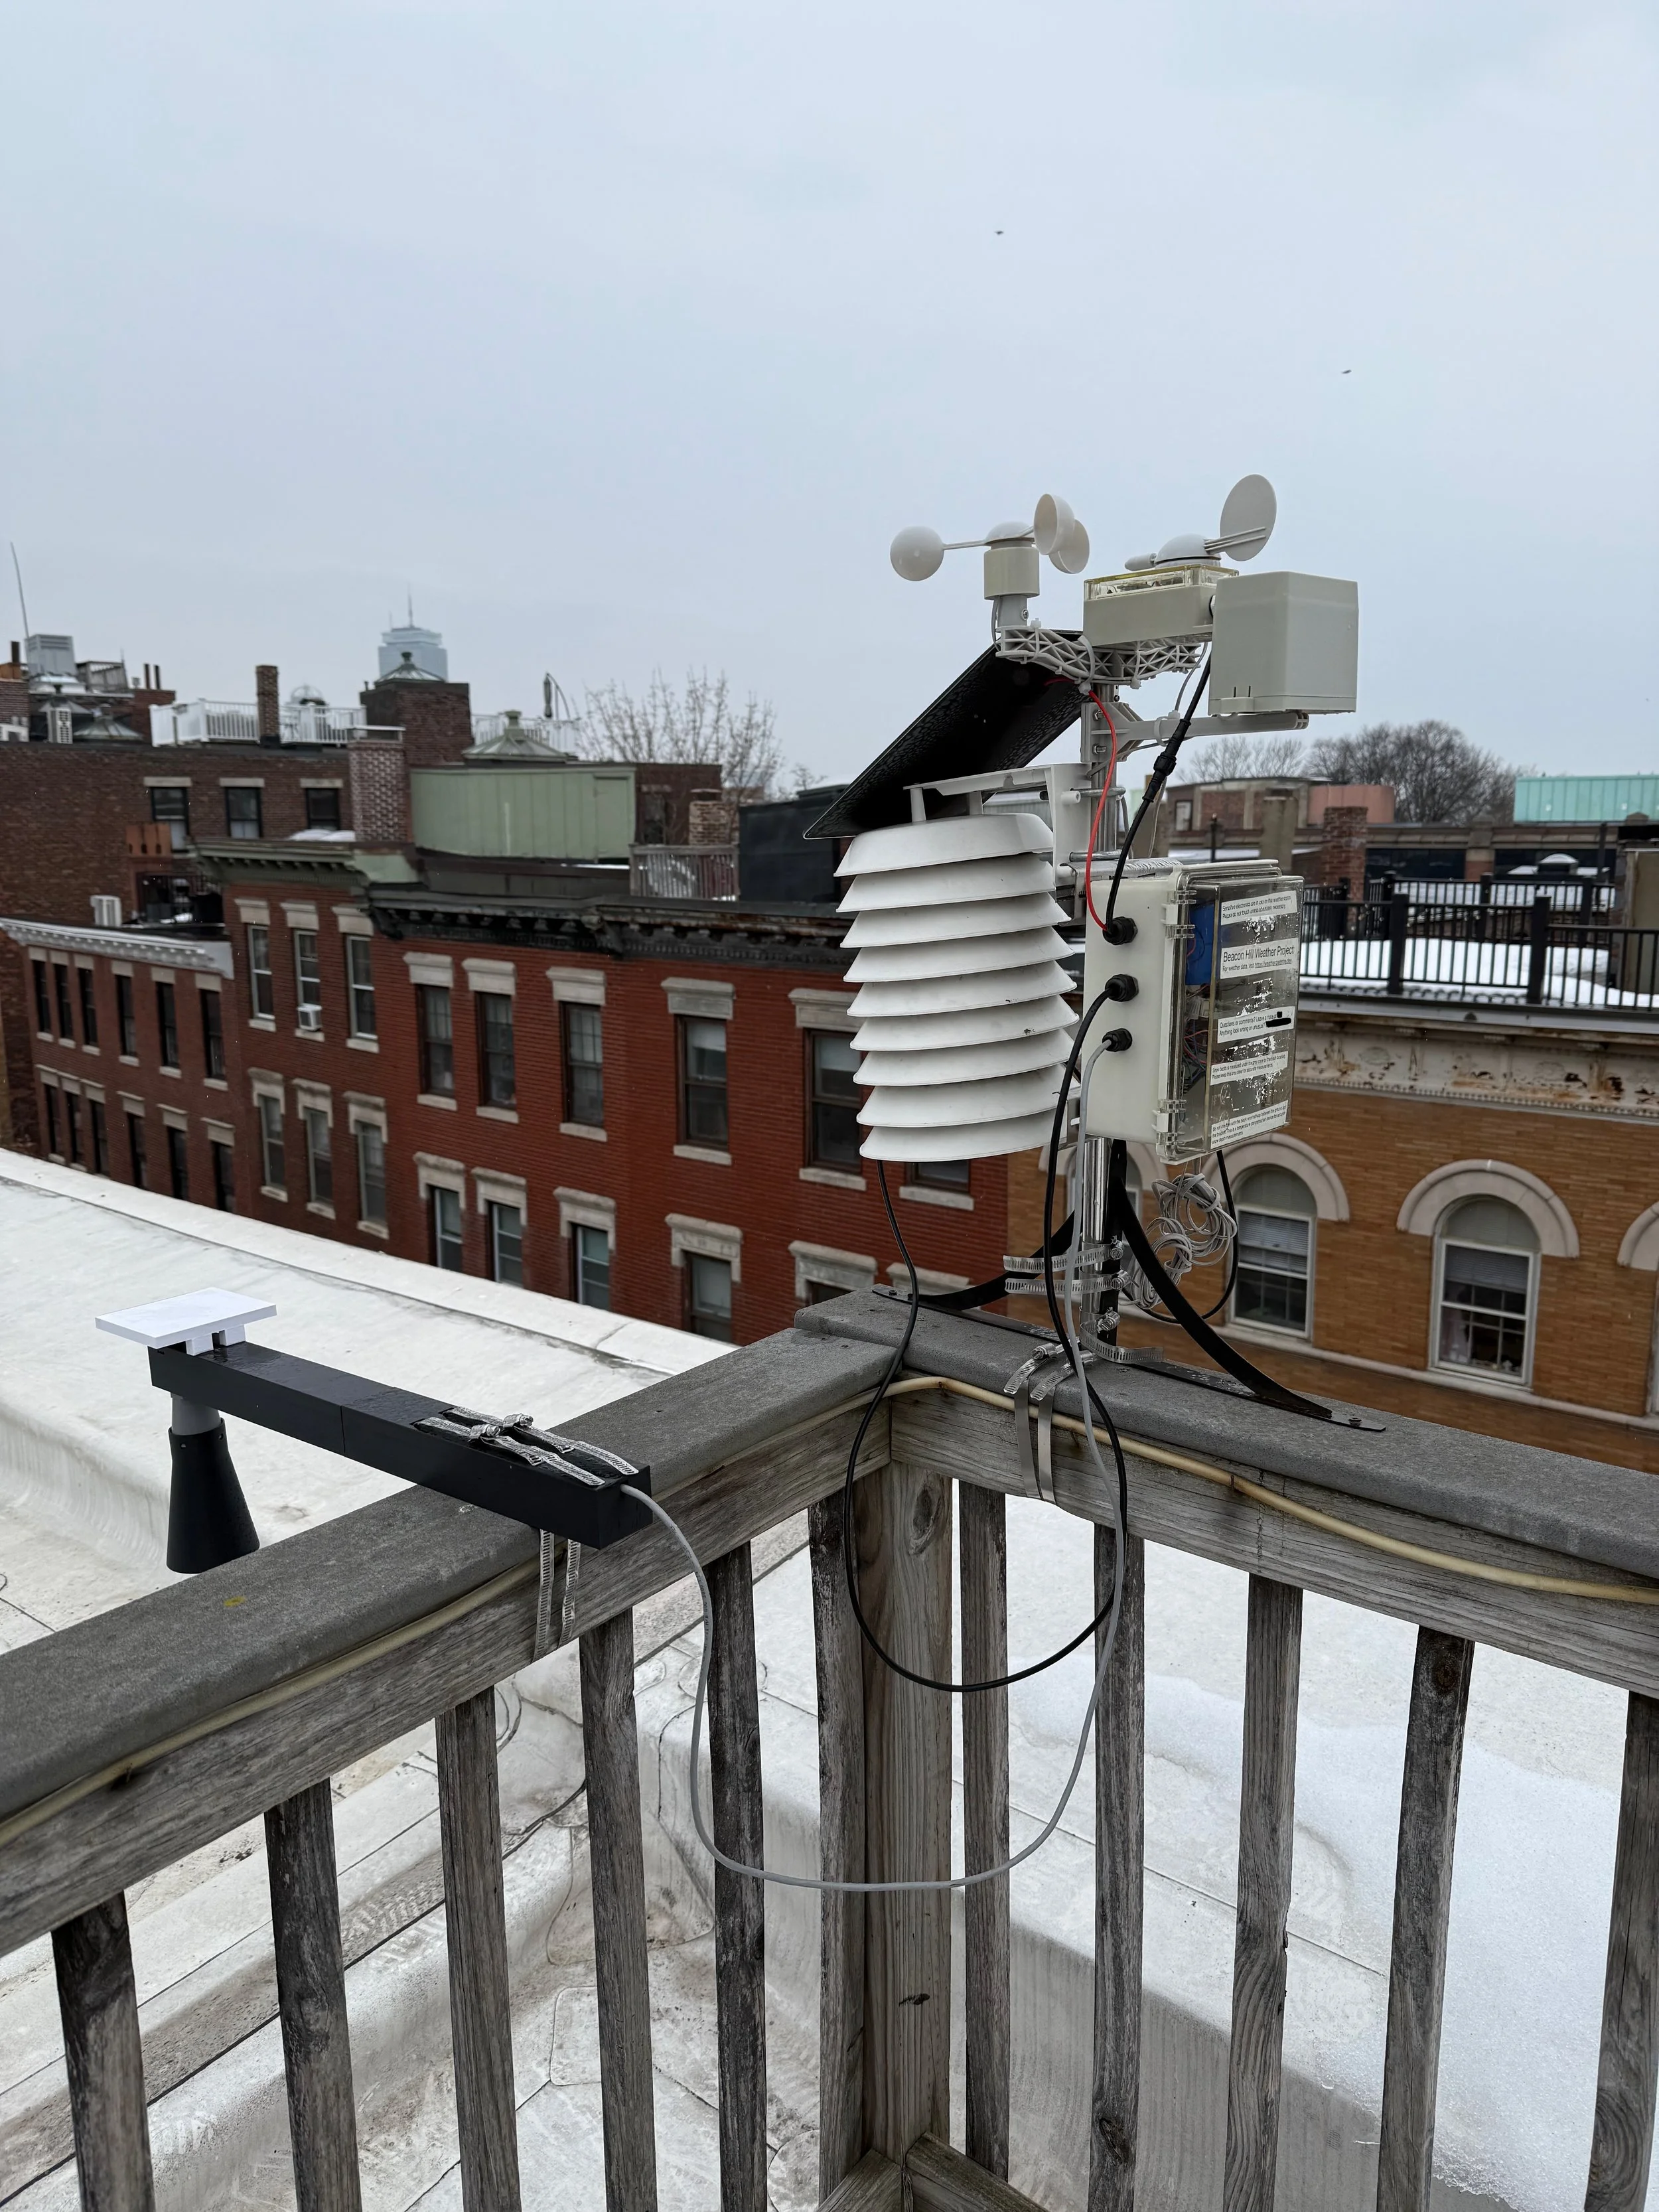
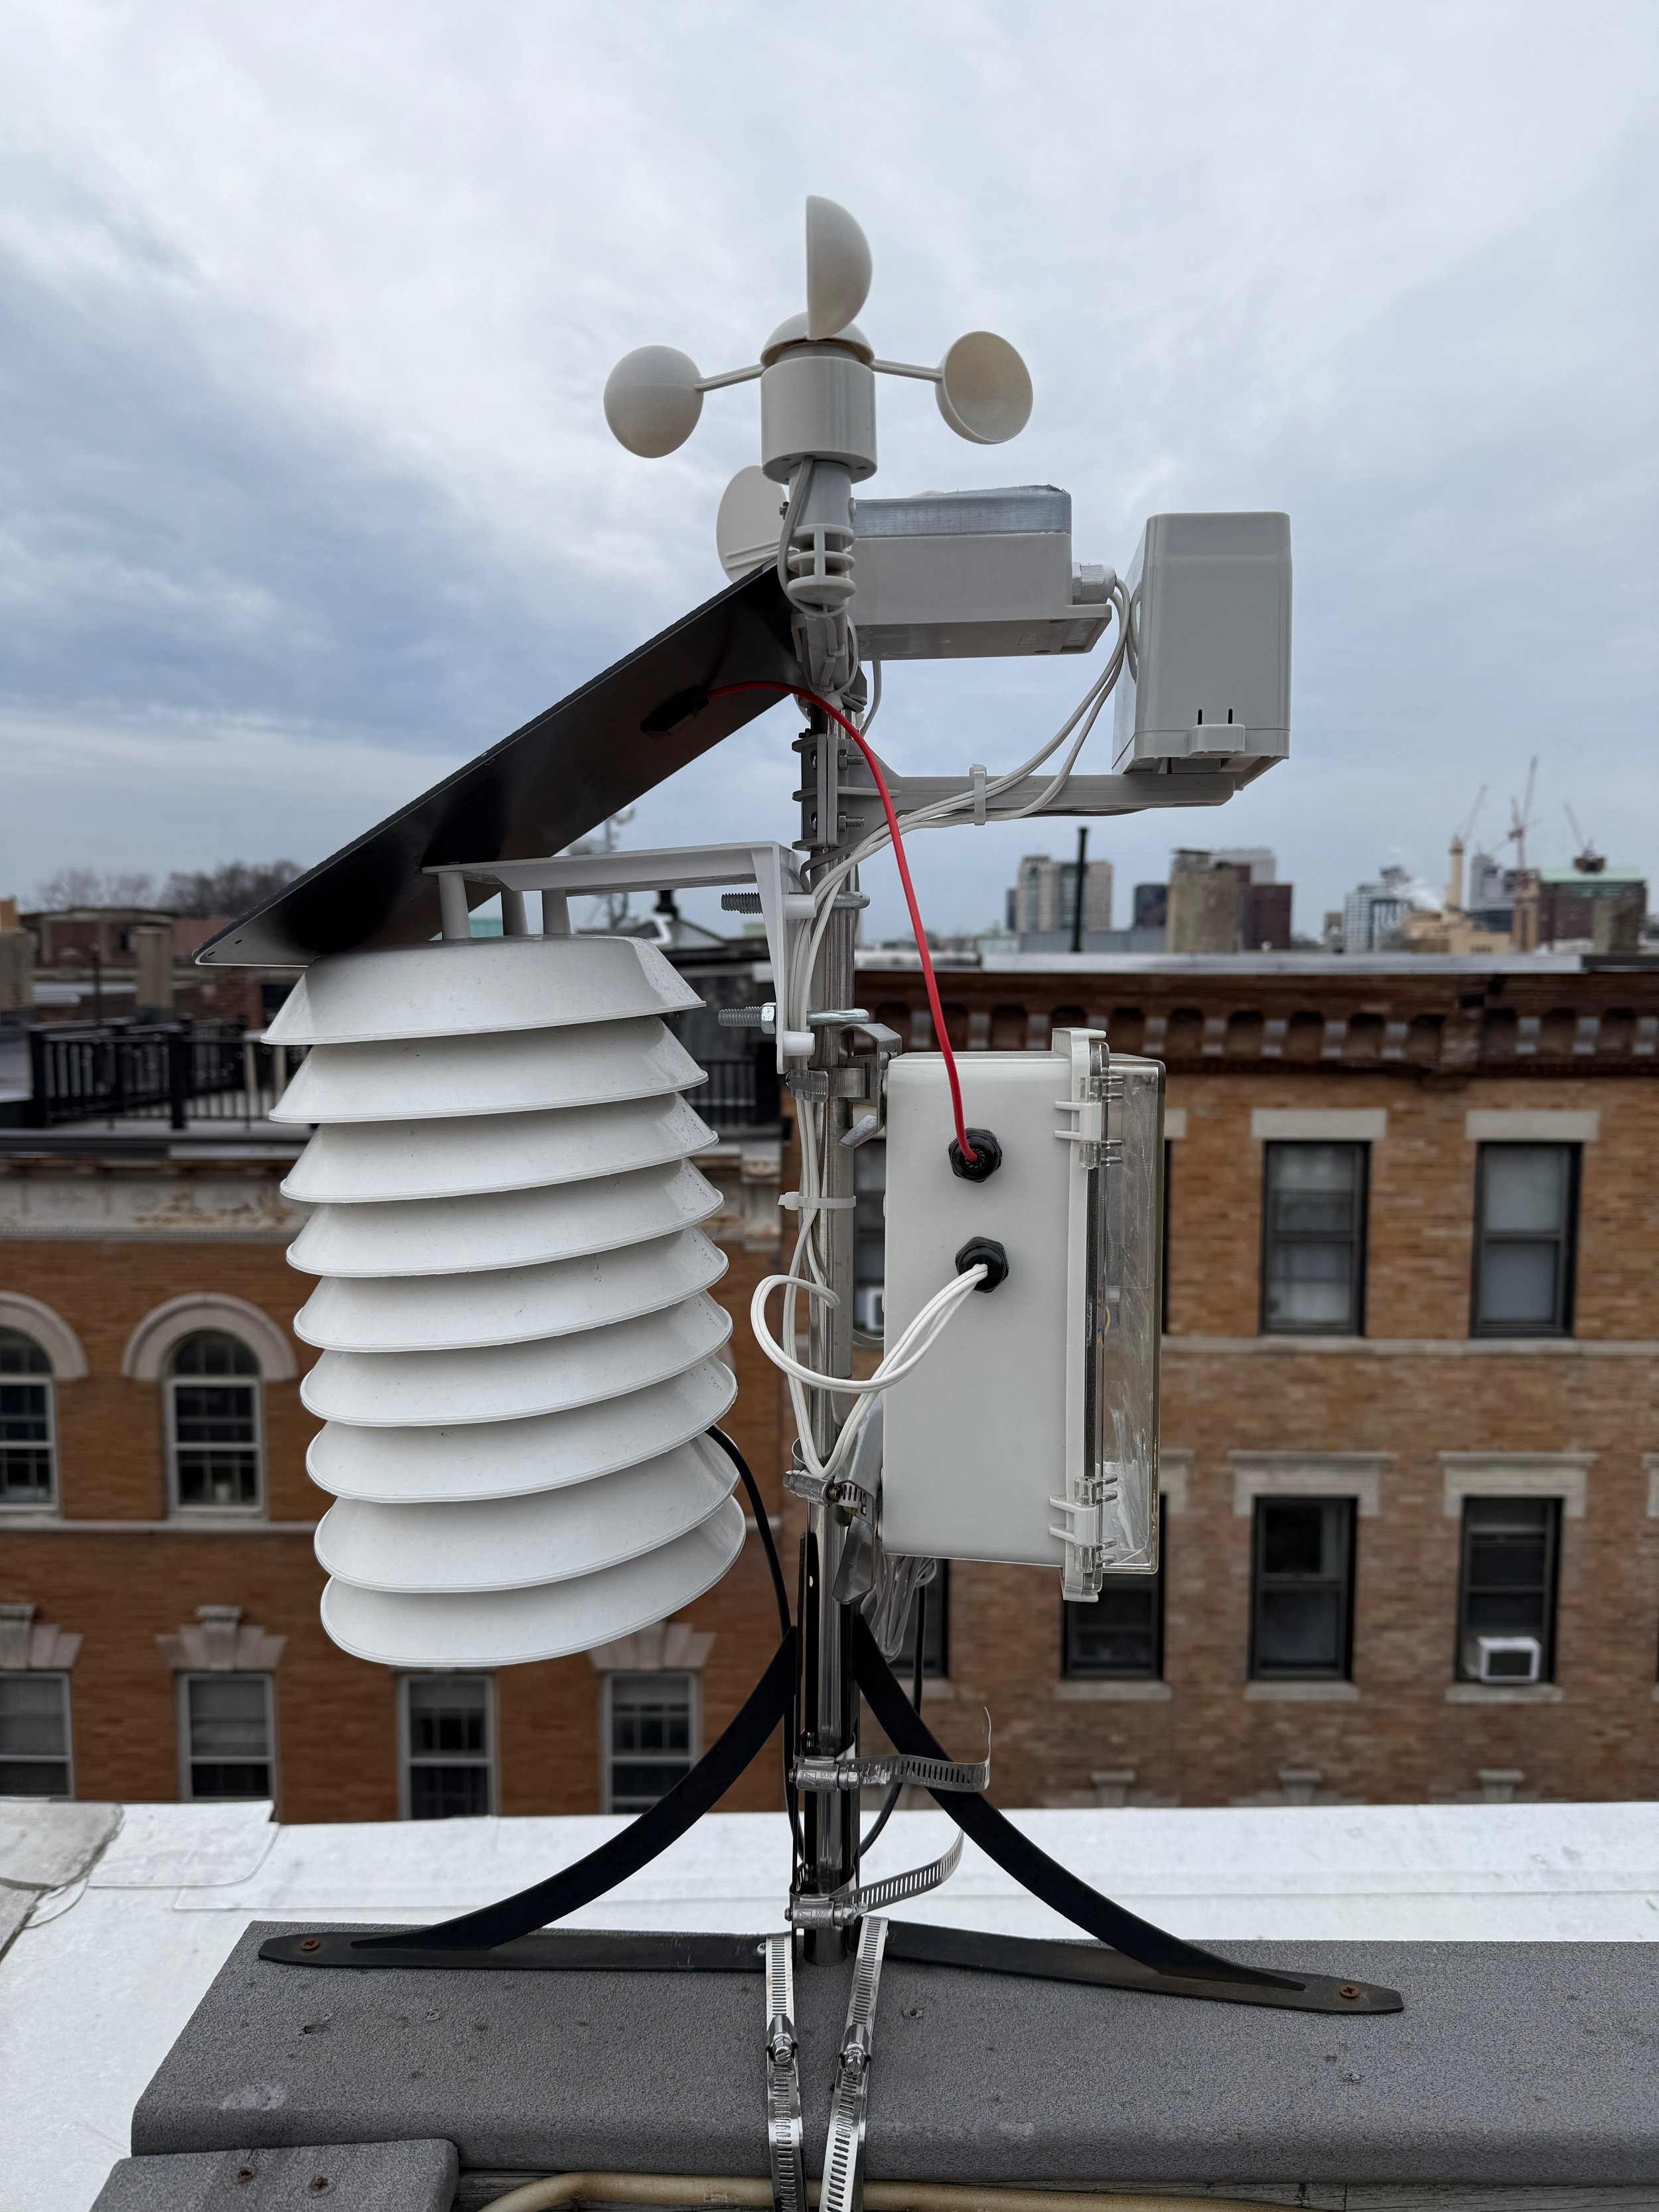
Here is your first look at Beacon Hill Weather. The station is based off of SparkFun’s Weather Kit, which includes the anemometer, wind vane, and rain bucket. Everything else is hardware I put on the station over time.
The station is mounted on a pole, in turn, mounted onto 2 random brackets I found on the roof, all secured with a lot of hose clamps. The station weighs quite a lot - I’d estimate 6 pounds or so, but is very stable and has survived quite gusty winds on the roof.
On the left you’ll see the snow depth sensor, and on the right is the bulk of the electronics and the station itself.
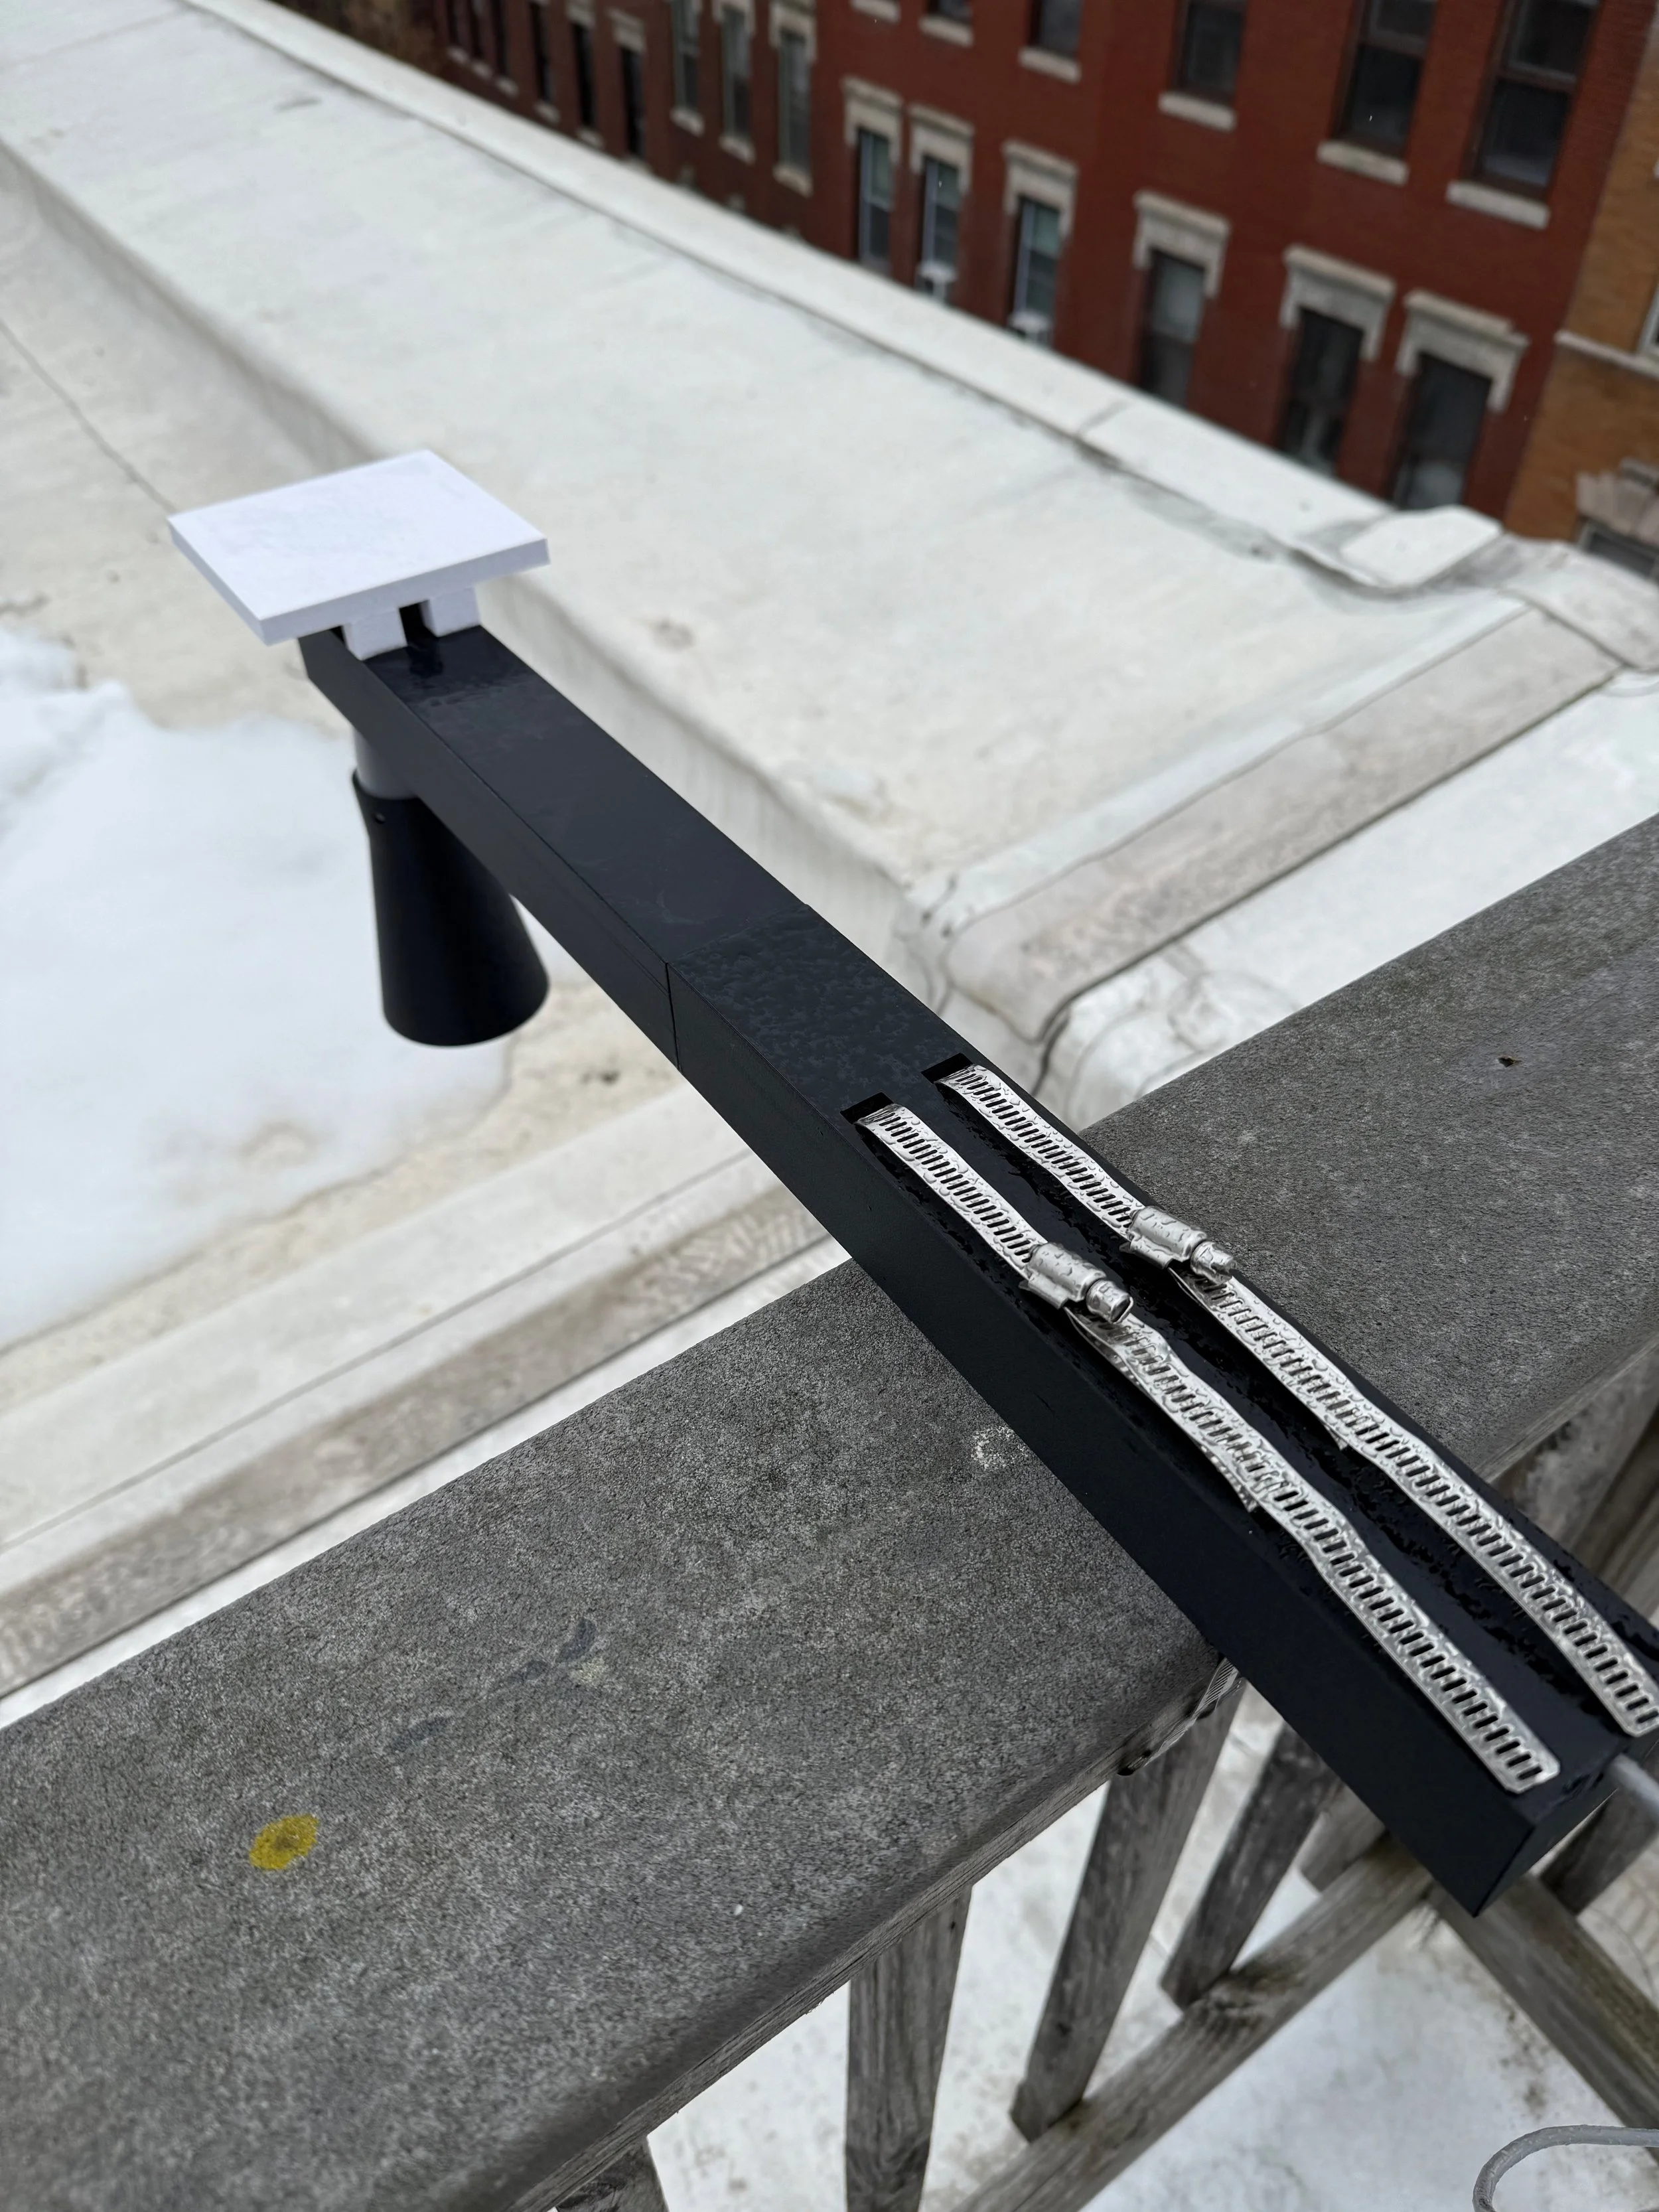
Before taking a look at the main station components - I want to briefly focus on the snow depth sensor and bracket, which is a recent addition and was (finally) completed in February 2026.
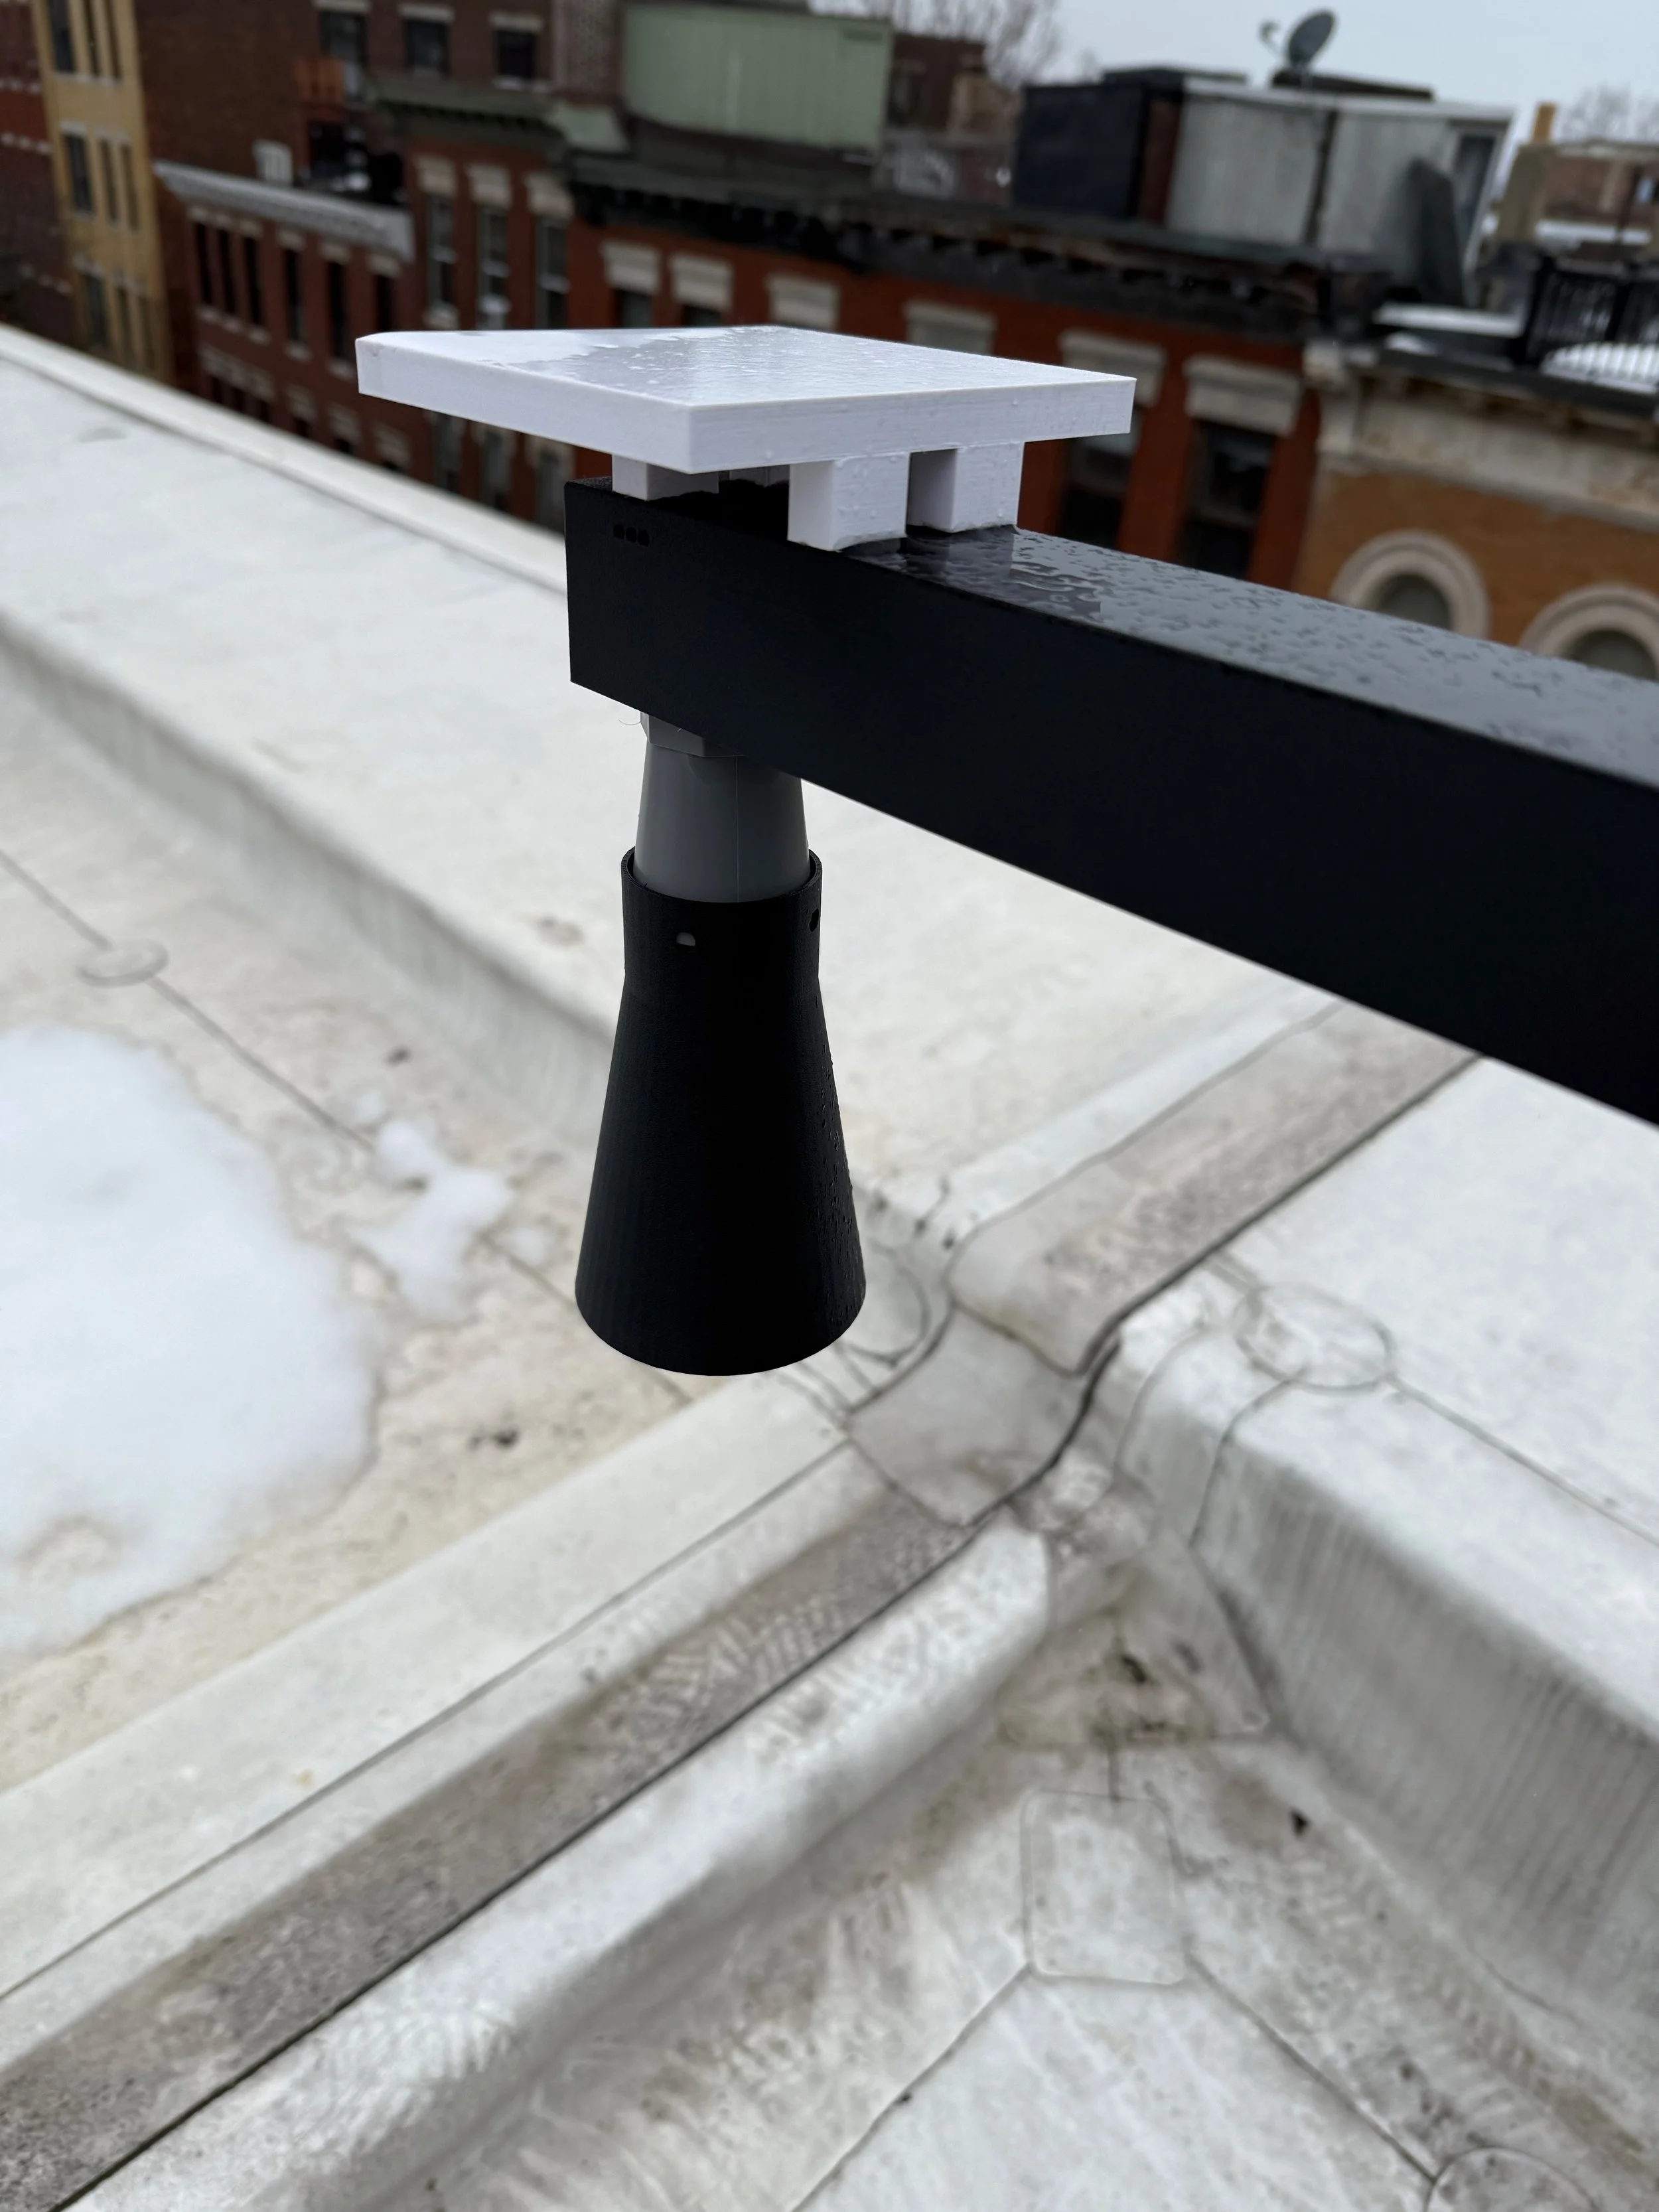
The sensor being used is the MaxBotix MB7374 ultrasonic distance sensor. This reports how far away the ground is in millimeters over serial, which is read by the station. There’s a lot of algorithmic work happening to ensure the semi-noisy readings from the MB7374 are smoothed out to prevent snow from being reported incorrectly.
The bracket is designed by myself in OnShape. It’s about 22 inches long. The bracket is 3D printed using ASA-CF with lots of wall layers and high infill to ensure good strength for holding the bracket. It’s printed into two parts due to my Bambu X1C’s smaller bed size.
The bracket is secured with hose clamps on the deck railing, which I measured & integrated mounting holes into the first part of the bracket. The wire for the snow sensor runs through the bracket out to the end, where it goes into the station through a gasket.
The white piece on the top was a futile attempt to control for swings in temperature on the sensor’s temperature compensation sensor (insert long ramble about speed of sound changing with temperature & how this affects the sensor), but this was resolved by adding an external temperature sensor mounted in the solar radiation shield.
On the MB7374 itself is a snap-on horn from MaxBotix that helps narrow the beam down for better snowfall detection readings. However, I printed the snap-on horn (also using ASA-CF) as MaxBotix provides the stl file online.
Technically this approach is not supported, as MaxBotix sells the horn with the sensor, then they factory calibrate it with the horn in mind. I needed a solution to narrow the beam width without having to RMA the sensor, and this approach worked quite well all things considered.
Given all the learnings from this last year with the sensor, I’ll be doing a lot of work in summer 2026 to redesign the bracket, get the sensor sent back for a real snap-on horn, and improve where the sensor actually gets mounted.
Okay, back to the actual station. From top to bottom - the wind vane and anemometer sit on top. Next to it is the “top sensor box” - this holds a light (VEML7700) & UV index (LTR390) sensor for those readings. Behind that is the rainfall collector.
Below all of this is the 10-watt solar panel used for charging the weather station. It’s pointed towards the south for the most sunlight, and the angle is ~45 degrees so it works well in the winter & summer.
It’s held up by a solar radiation shield (Ambient Weather SRS100LX) - arguably this one is quite big for the station, but it’s absolutely necessary given the station is not in the shade. Otherwise, temperature readings would be 5ºF higher than ambient. Both the SHT30 and MB7374’s external temperature sensor are housed in the shield.
Finally, the junction box with all the electronics is below that - but more on that shortly.
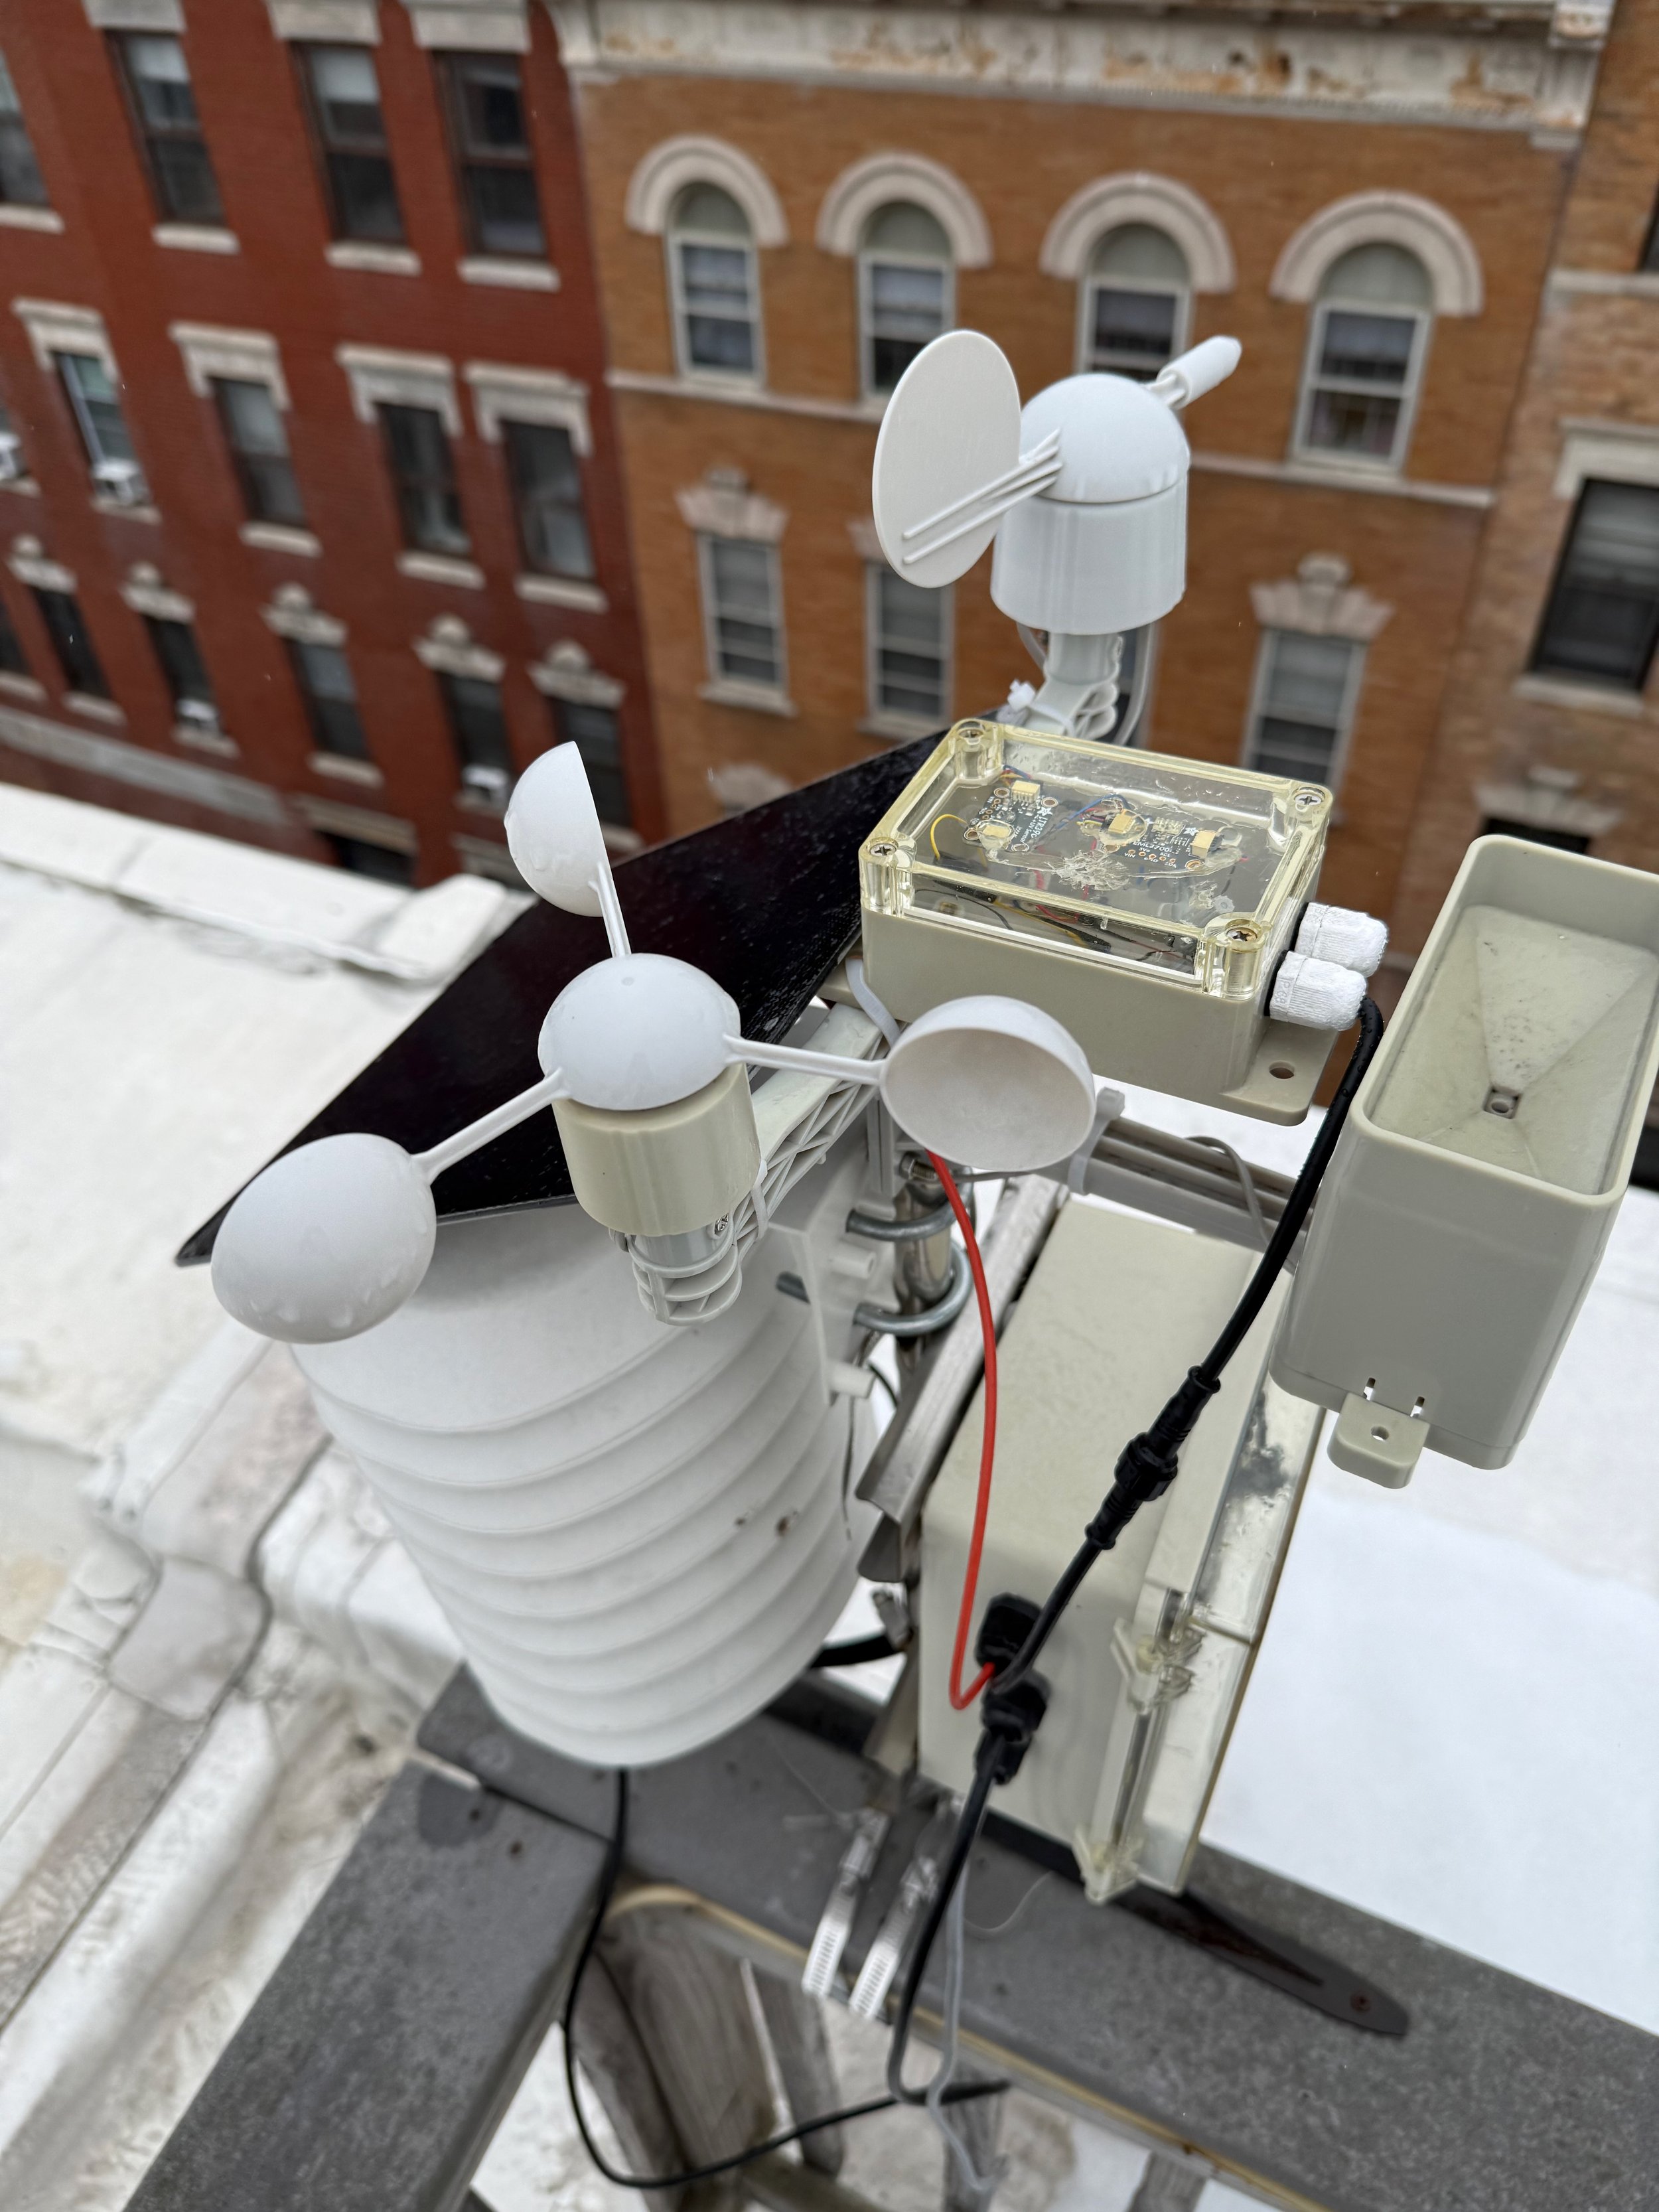
Here is a closer view of the top box where you can see the LTR390 and VEML7700 sensors. They are wired up using I2C, and I got a waterproof, 4-wire cable from Adafruit that allows the GND, 3V3, SDA & SCL lines to neatly integrate with the box.
The station is also quite dirty, but it’s been sitting outside for almost 18 months now…
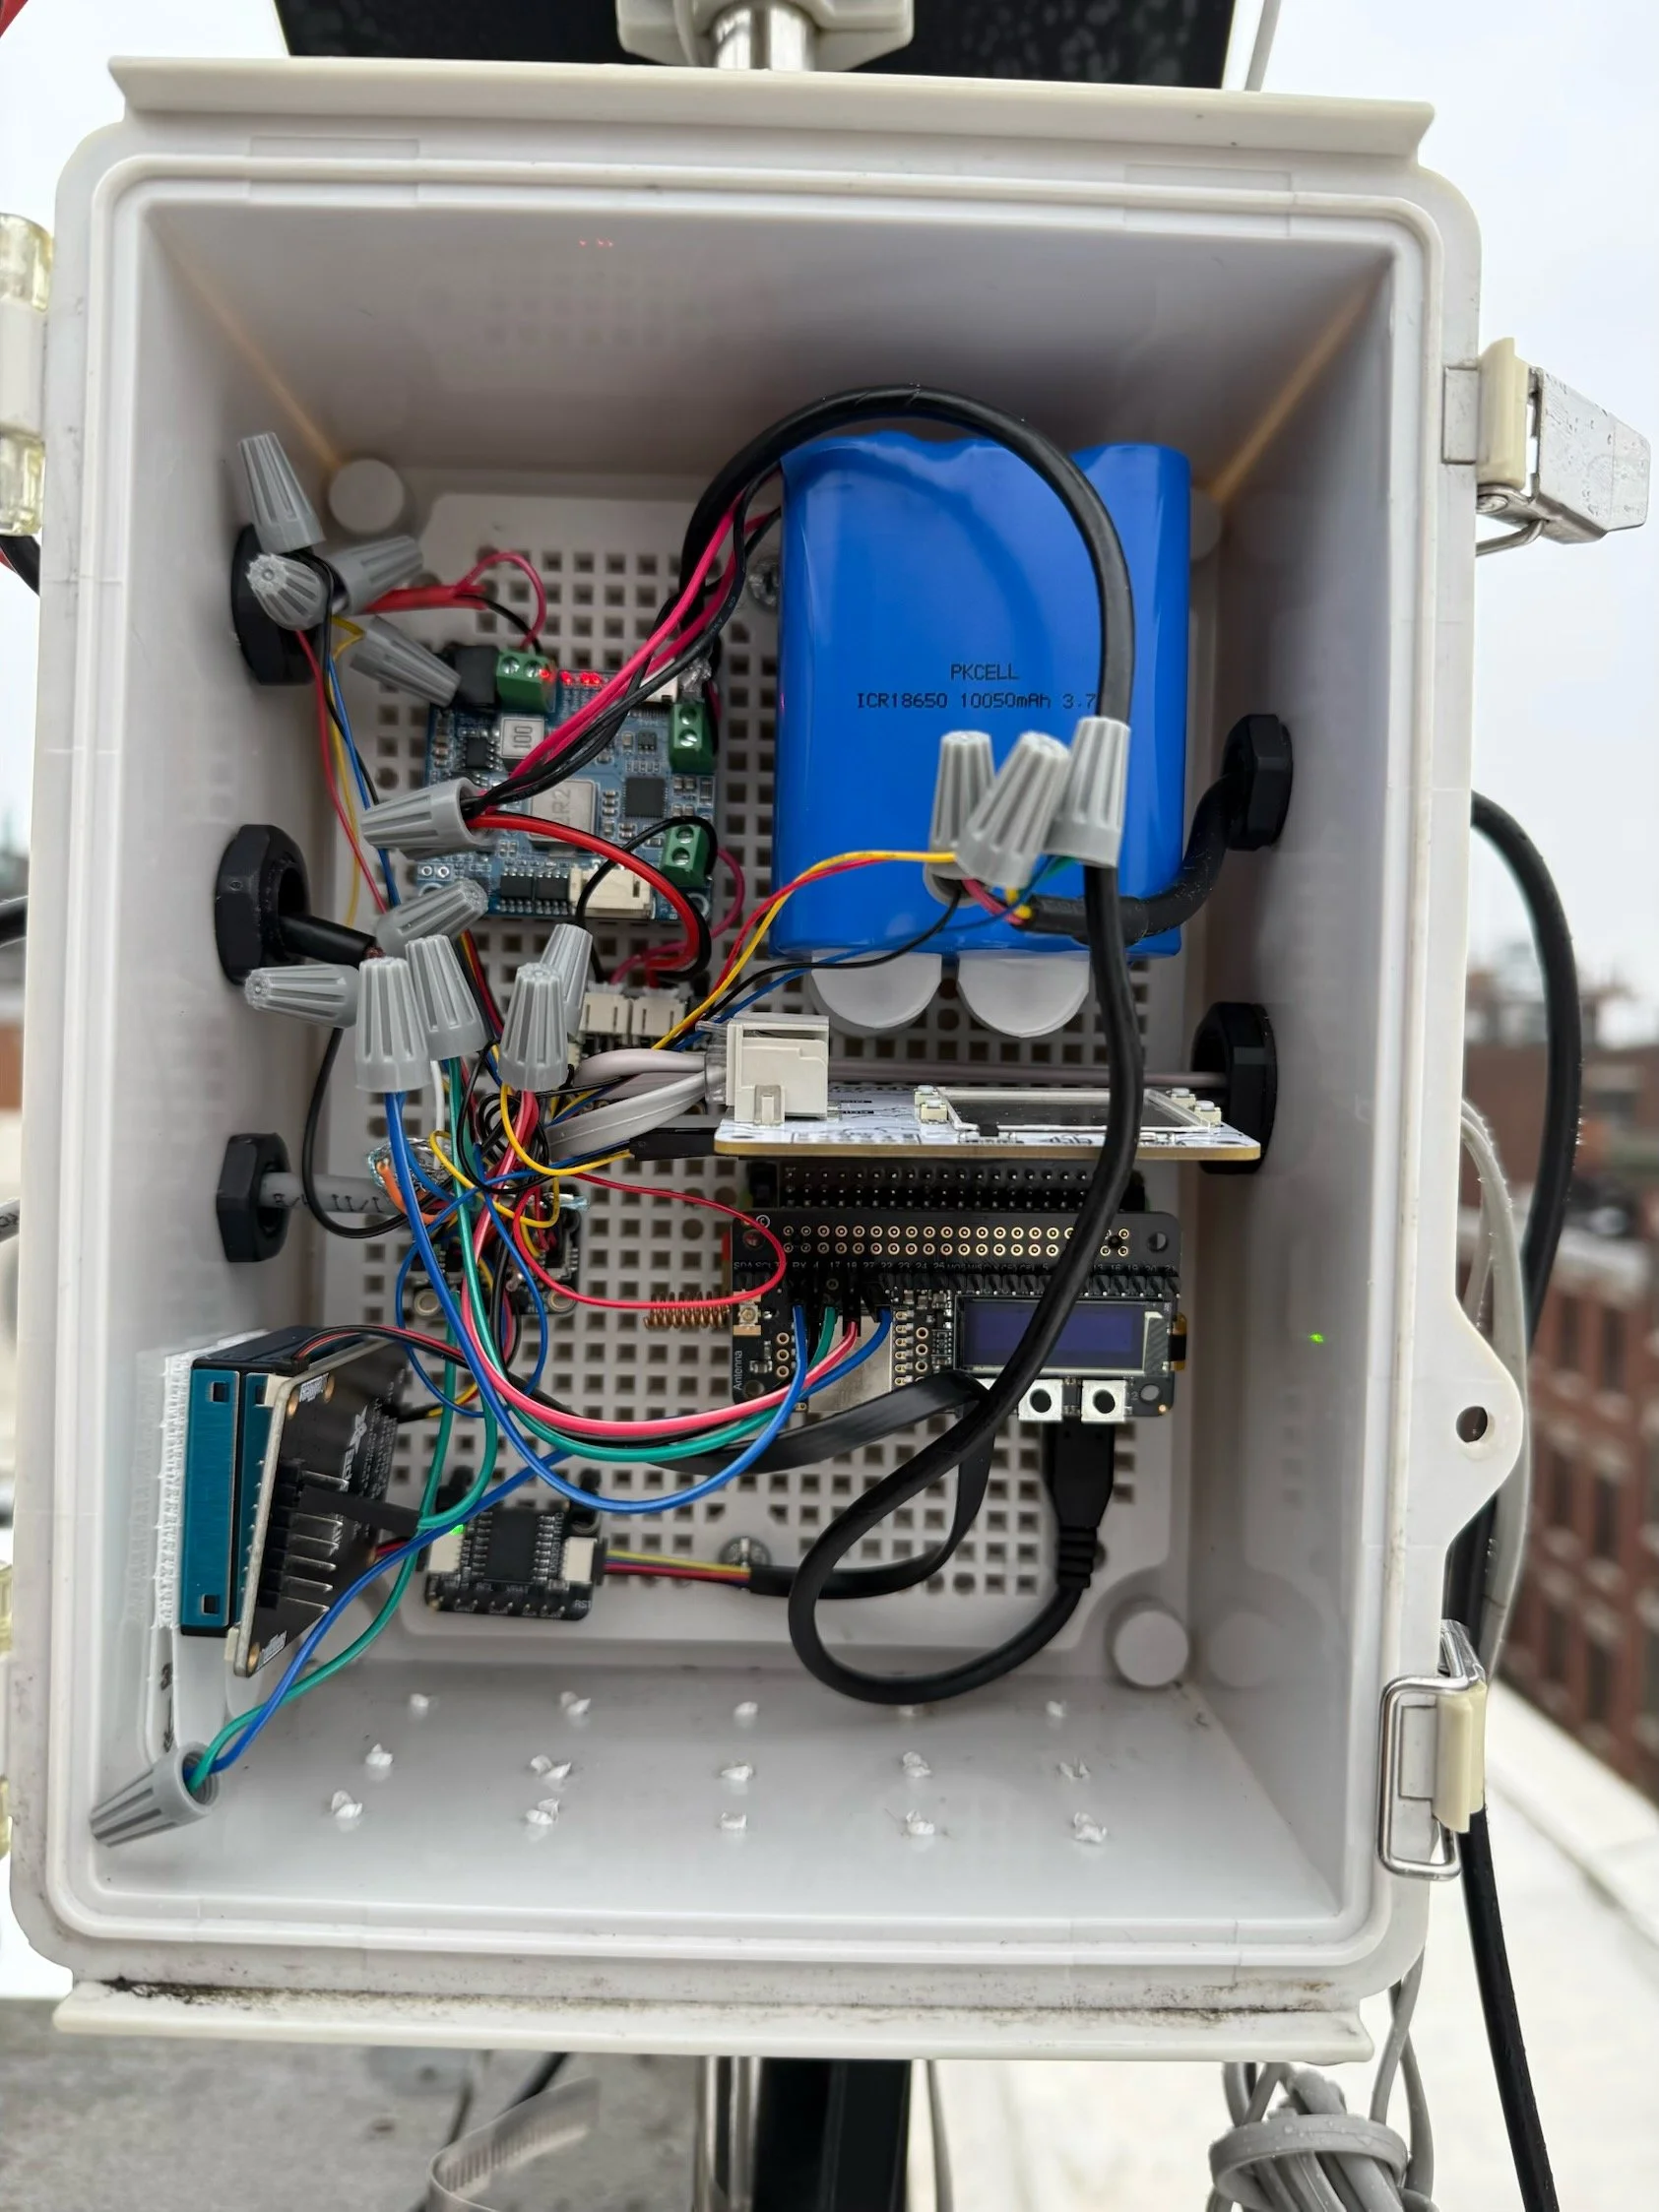
Here is the junction box where all the station electronics are stored. The wiring in here is very messy as you can see, especially with the addition of the MB7374.
There are five gaskets of varying PG-sizes that contain the wires going in and out of the station, 3 on the left, 2 on the right. There are 15 ventilation holes at the bottom which keep the station cool in the summer, and allow for fresh air to reach the AQI sensor.
At the top left is the solar recharging board from Waveshare. This takes in the DC power from the panel, and goes straight into the battery for recharging. A MAX17048 battery gauge sits between the board & the batteries to log battery voltage & state-of-charge over I2C. The board also provides 5V out to power the Raspberry Pi over USB.
The batteries on the left are two 10,500 mAh packs wired in parallel, for a total capacity of 21,000 mAh at a 3.7 V nominal voltage. With some recent tweaks to reduce the power usage of the Pi, it can last about 4-5 days in cloudy weather.
Below the battery is the brains of the station, the Raspberry Pi Zero 2 W. This is the lowest-idling Pi that exists (iirc), and with some tweaks I think it idles around 80 mA, which isn’t too bad. On top of it is the WeatherHAT from Pimoroni, which plugs into the wind vane & anemometer, and provides an ADC onboard, which then allows me to read the switch counters to get wind speed, direction, and rainfall amounts. The board also includes a BME280, which I use to log internal temperature & pressure.
Below that is Adafruit RFM95 LoRA radio bonnet, which is how the station communicates with the receiver. Previously, this was a RFM69, but I found that in my urban environment, LoRA does a lot better. It also has the advantage of 252-byte packets, which can fit all weather data in a single packet (vs 60 bytes on the RFM69, requiring me to split it up). The bonnet has a small OLED and 3 buttons attached, which I will talk about shortly.
While a Pi seems like a silly choice given how much power it consumes over something like a ESP32 - it’s actually not as bad as you think. Given the station has to constantly read from the switch counters to get accurate rainfall & snowfall totals (every 3s), and reads every 7 seconds from the MB7374, I wouldn’t get the deep sleep power benefits from ESP32s. At best, I’d probably get 50% power savings, but coming at the cost of harder debugging, less log storage, and needing a relatively bespoke ESP32 with large PSRAM to handle the numerous device libraries. The Pi reduces a lot of these headaches.
On the left is PMSA003I air quality sensor, behind that is a DS3231 RTC that is temperature-compensated internally. Hidden behind all the wires is also a 5-port Stemma QT hub that neatly breaks out I2C for all sensors - the station is mostly I2C (aside from the MB7374).
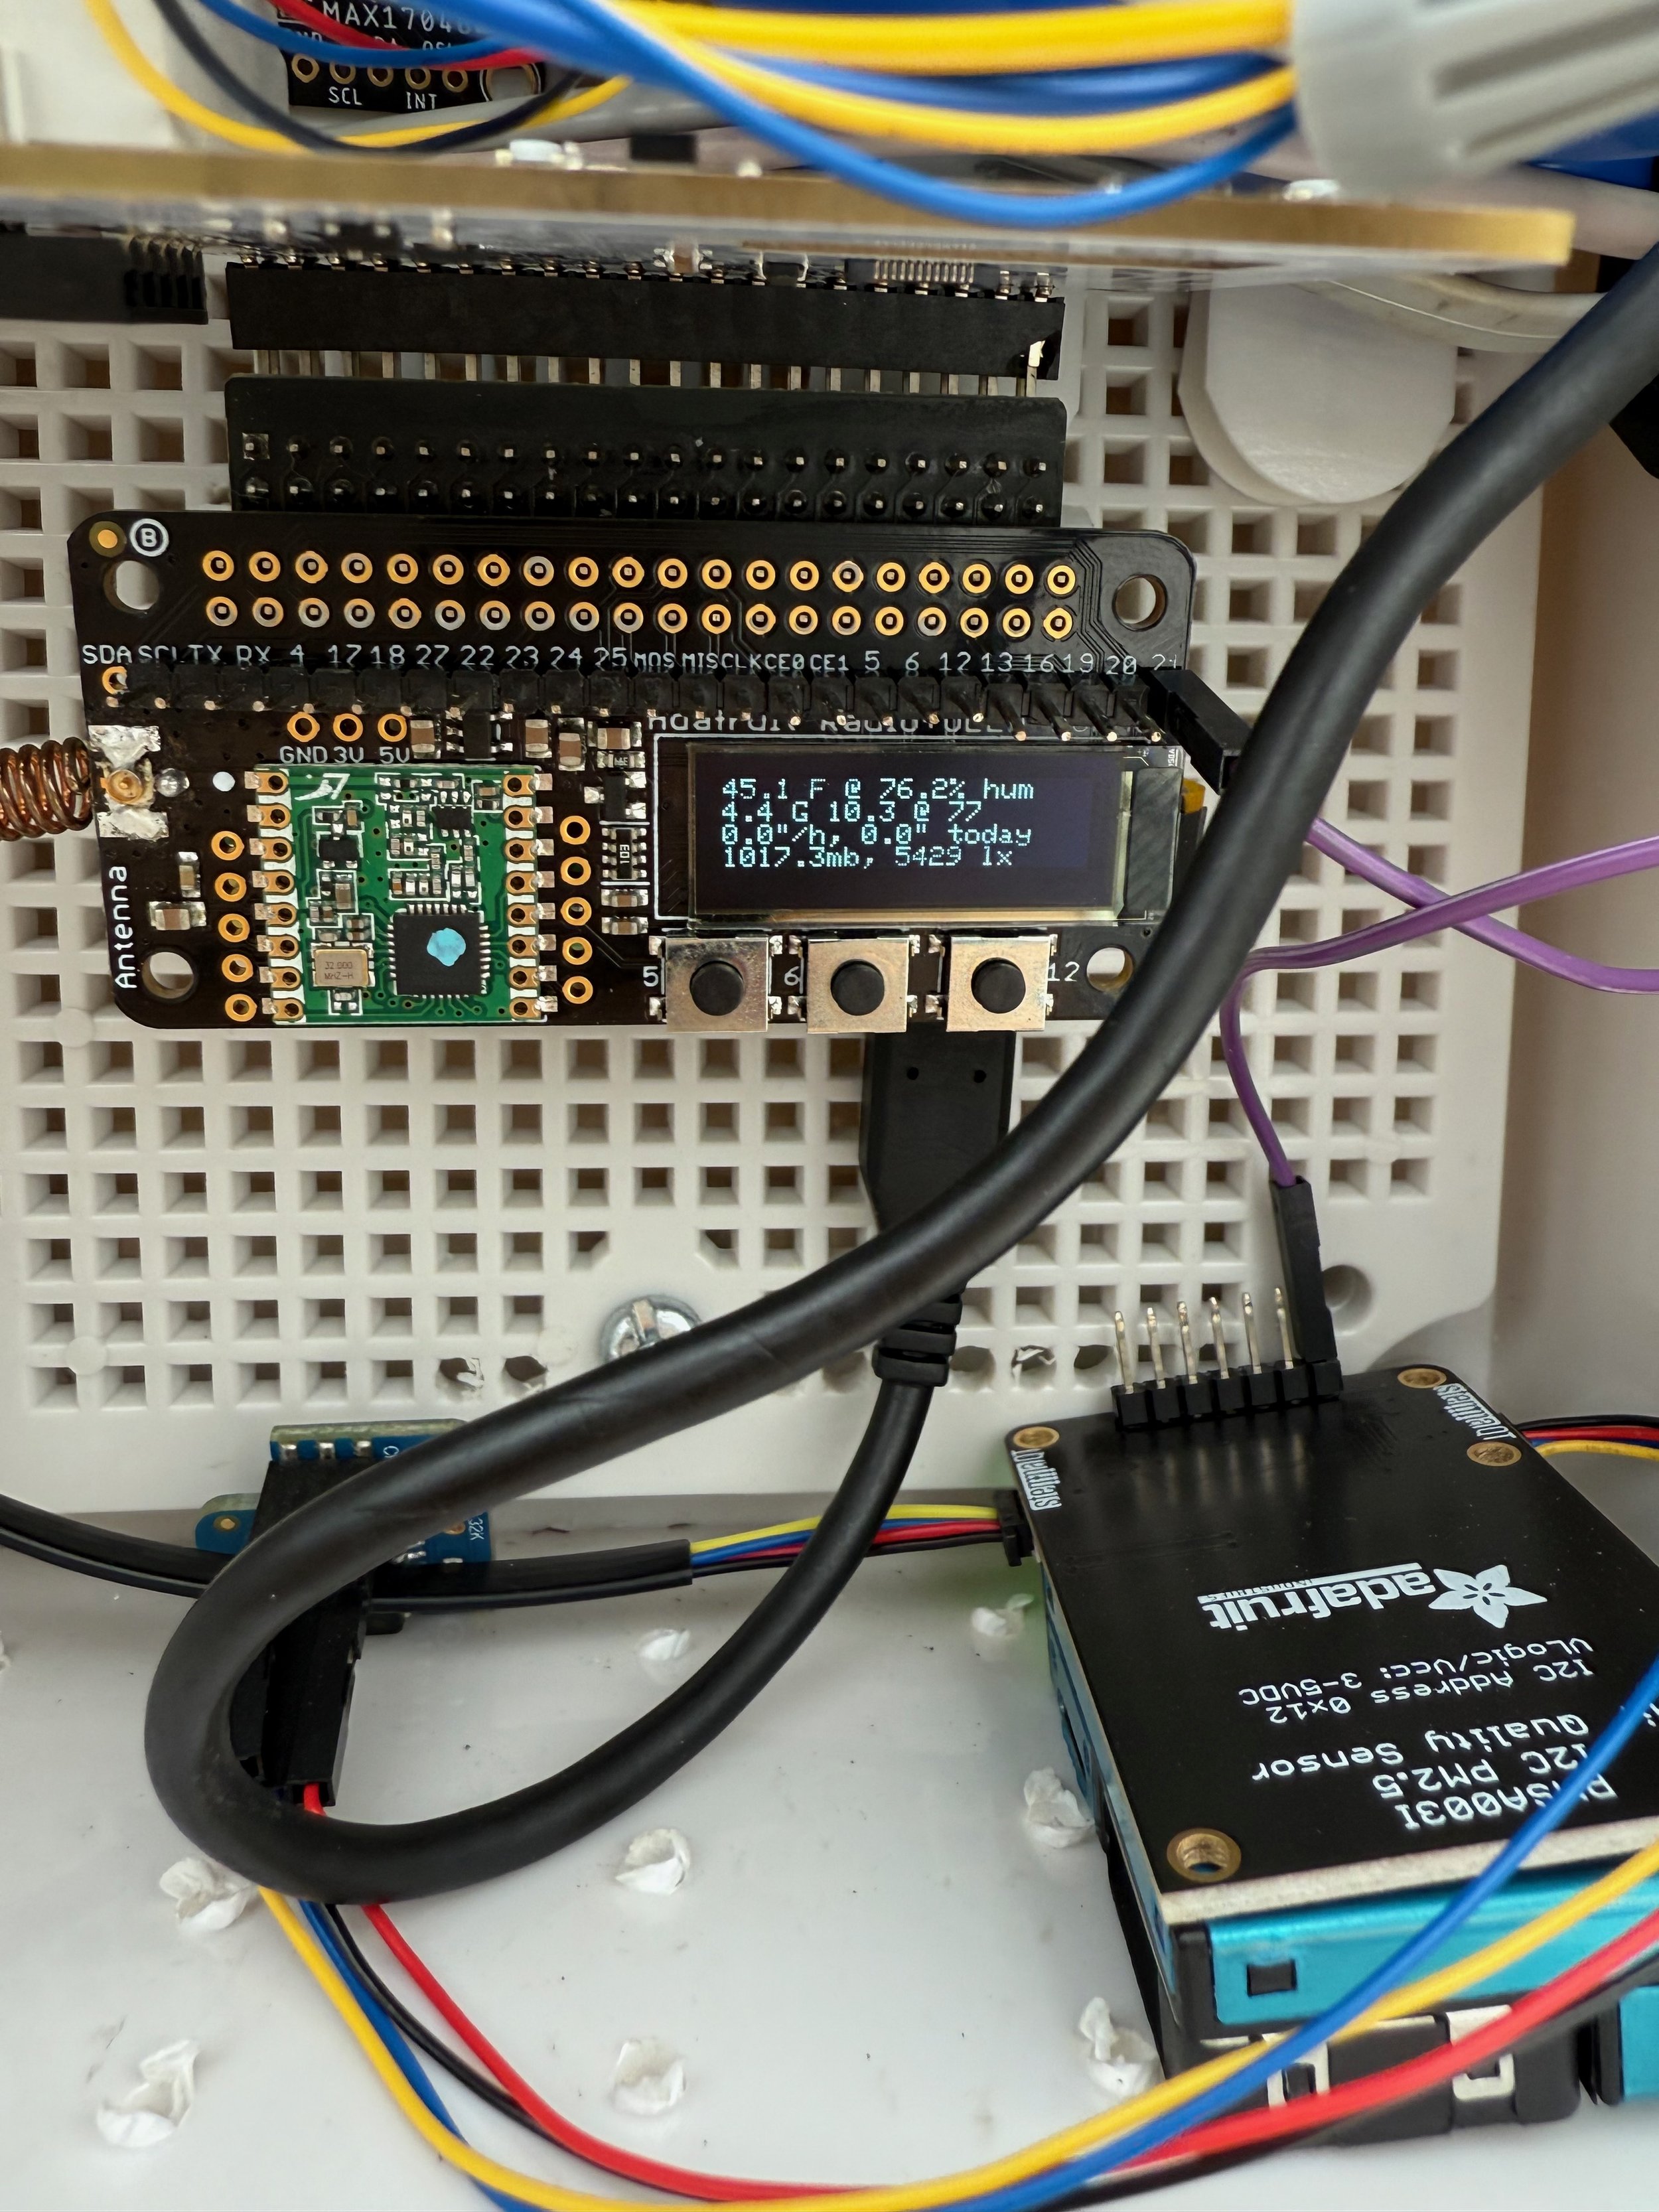
This is a slightly older photo from when the RFM69 was onboard - but I use the OLED on the screen for a couple of purposes. At boot time, it shows if checks for each sensor are passing or failing, turning off when the boot is finished.
Three buttons on the bottom control three different screens - the first two are mostly for checking the time & battery levels, but the third one allows you to see the weather on the weather station! In the very, very early days of Beacon Hill Weather, this was the only way you could see the readings, and it’s stuck to this day.
It’s an impressive amount of detail to squeeze on a 128×64 OLED screen.
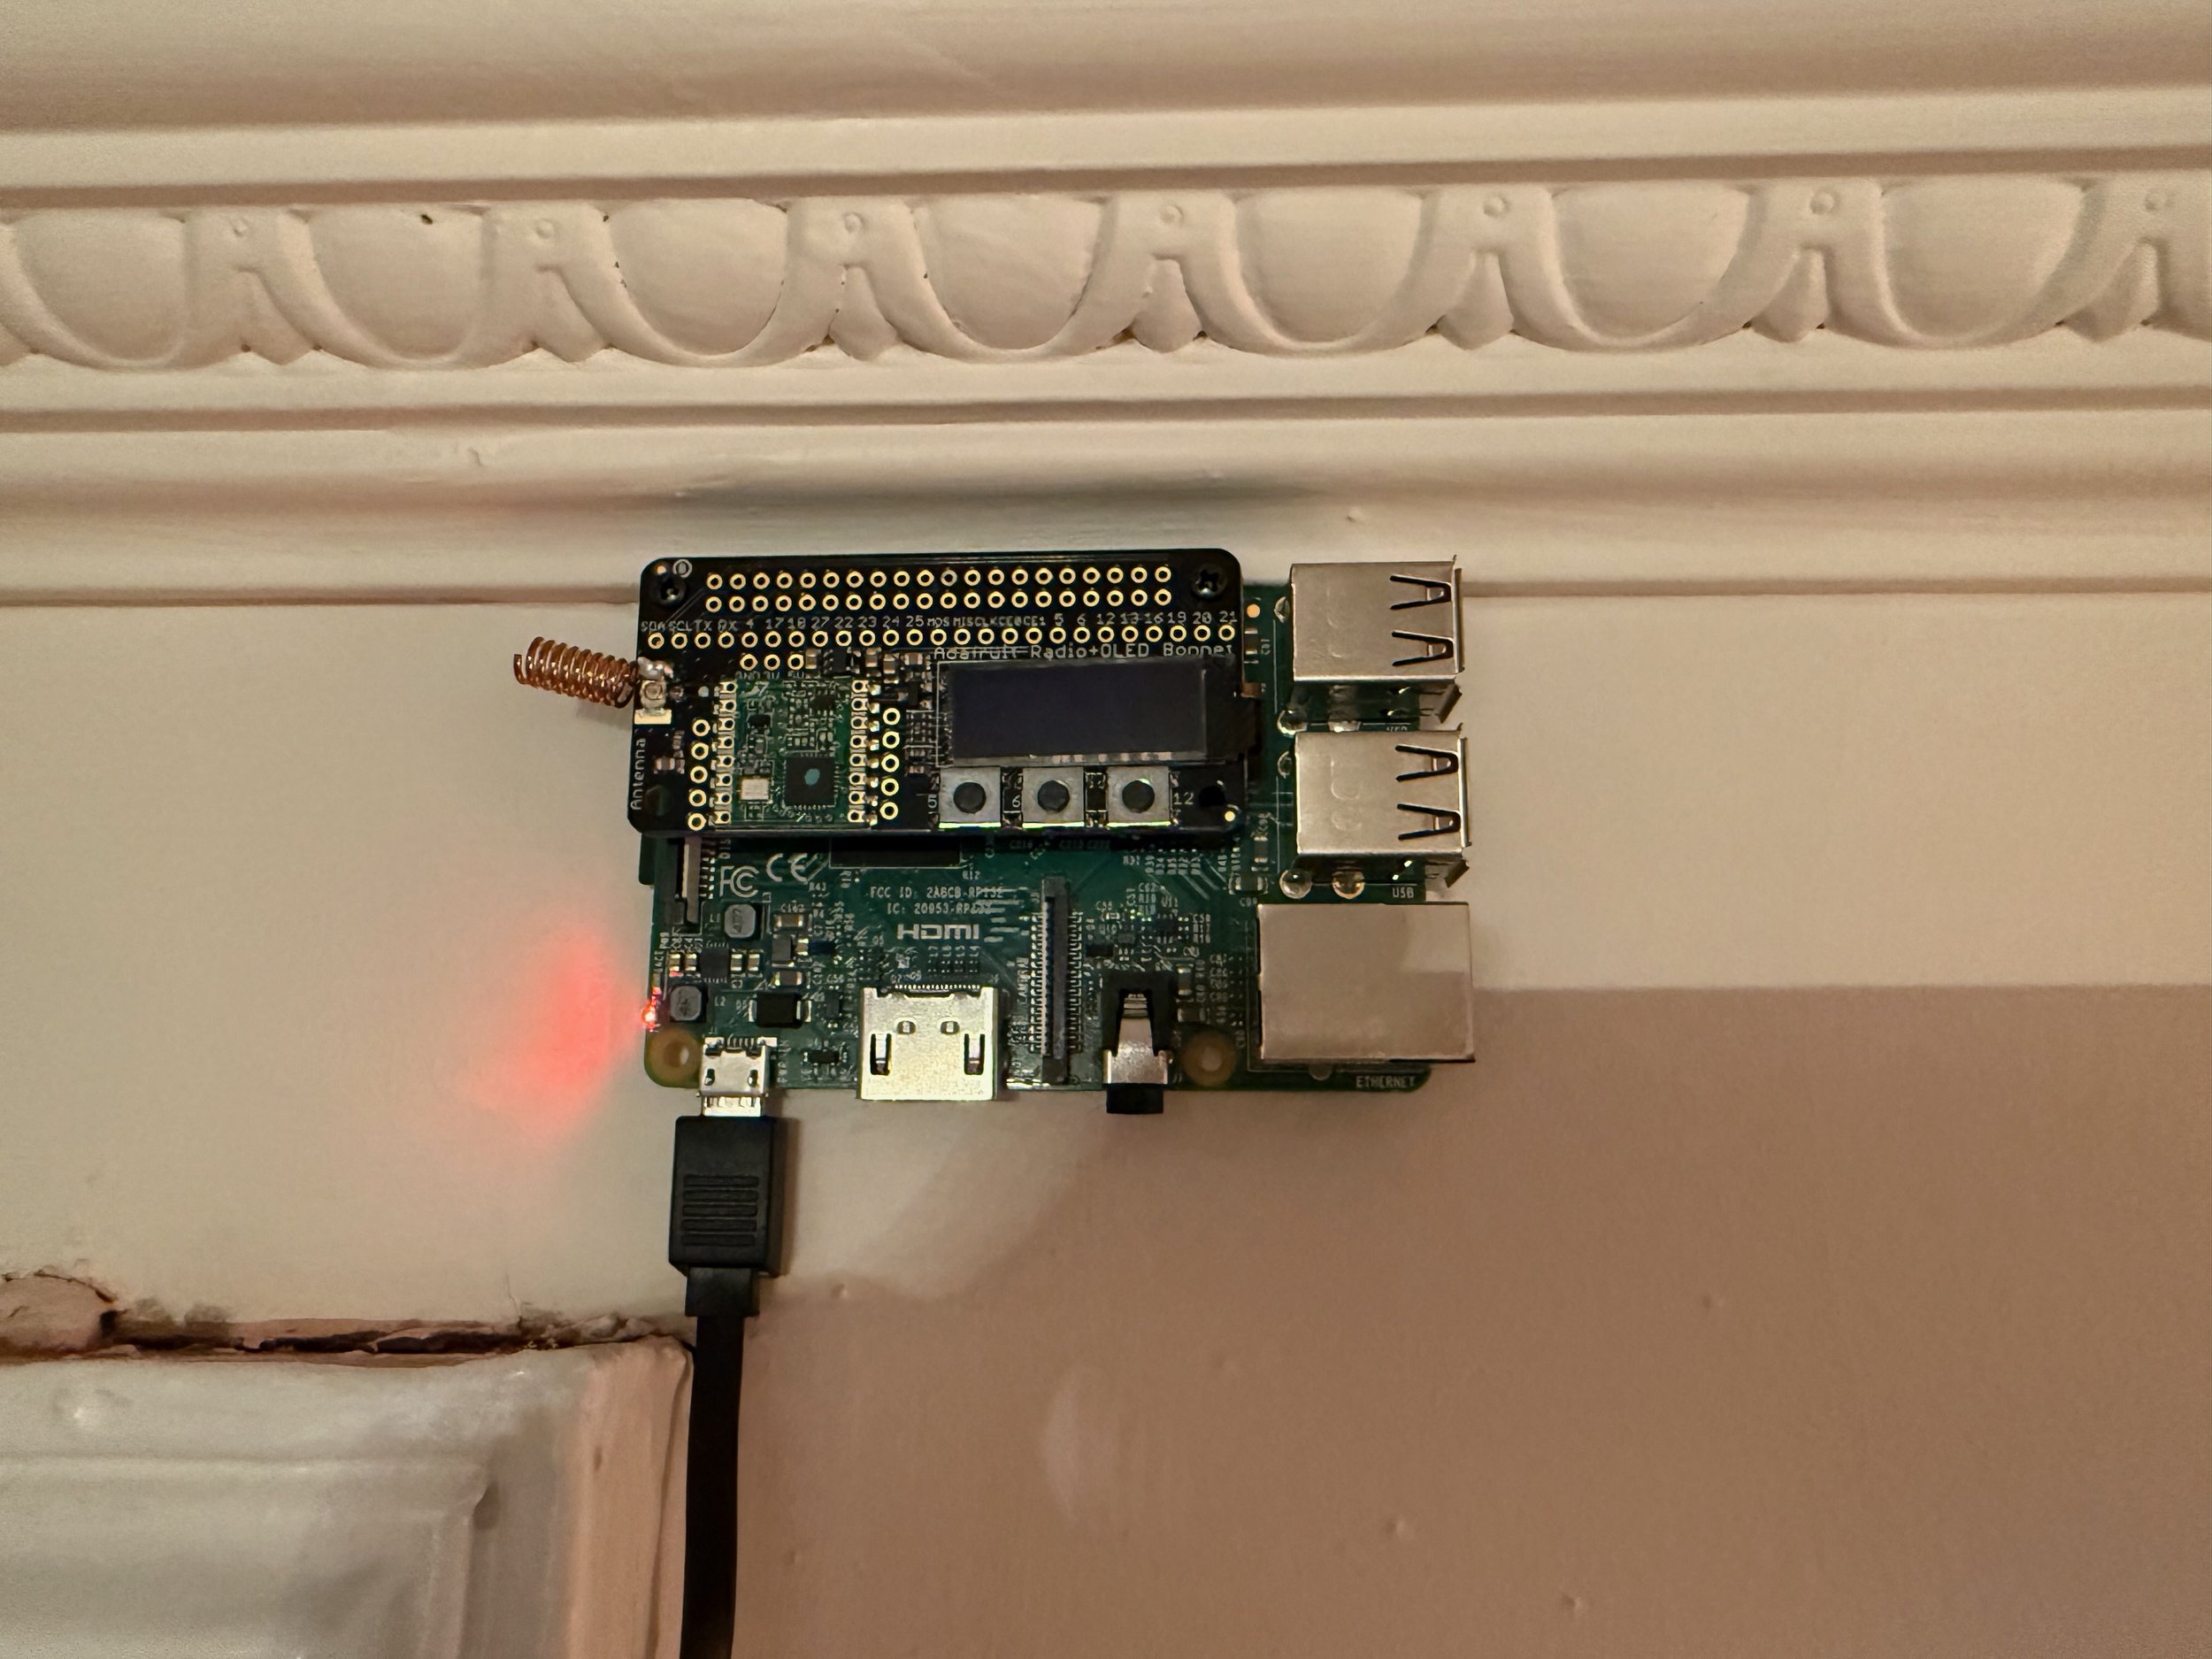
Downstairs in my apartment, you’ll find another Raspberry Pi (this time, a 3B) acting as the receiver for data from the weather station.
Note that this photo is a little outdated - the RFM69 is present, and now I use an antenna to improve reception, but the concepts remain the same.
The receiver mostly exists to receive data from the weather station, then send it to the API for ingesting. It does a bit of transformation as well - adding the feels like temperature, and ensuring fields are filled out correctly. It also can talk to the station when it asks what time it is.
Otherwise, communications are mostly station → receiver only, but I intend to change this in 2026 by adding two-way communication with listening periods every minute, which should be a good way to give the station commands (send log data, reboot, etc) without eating into power consumption.
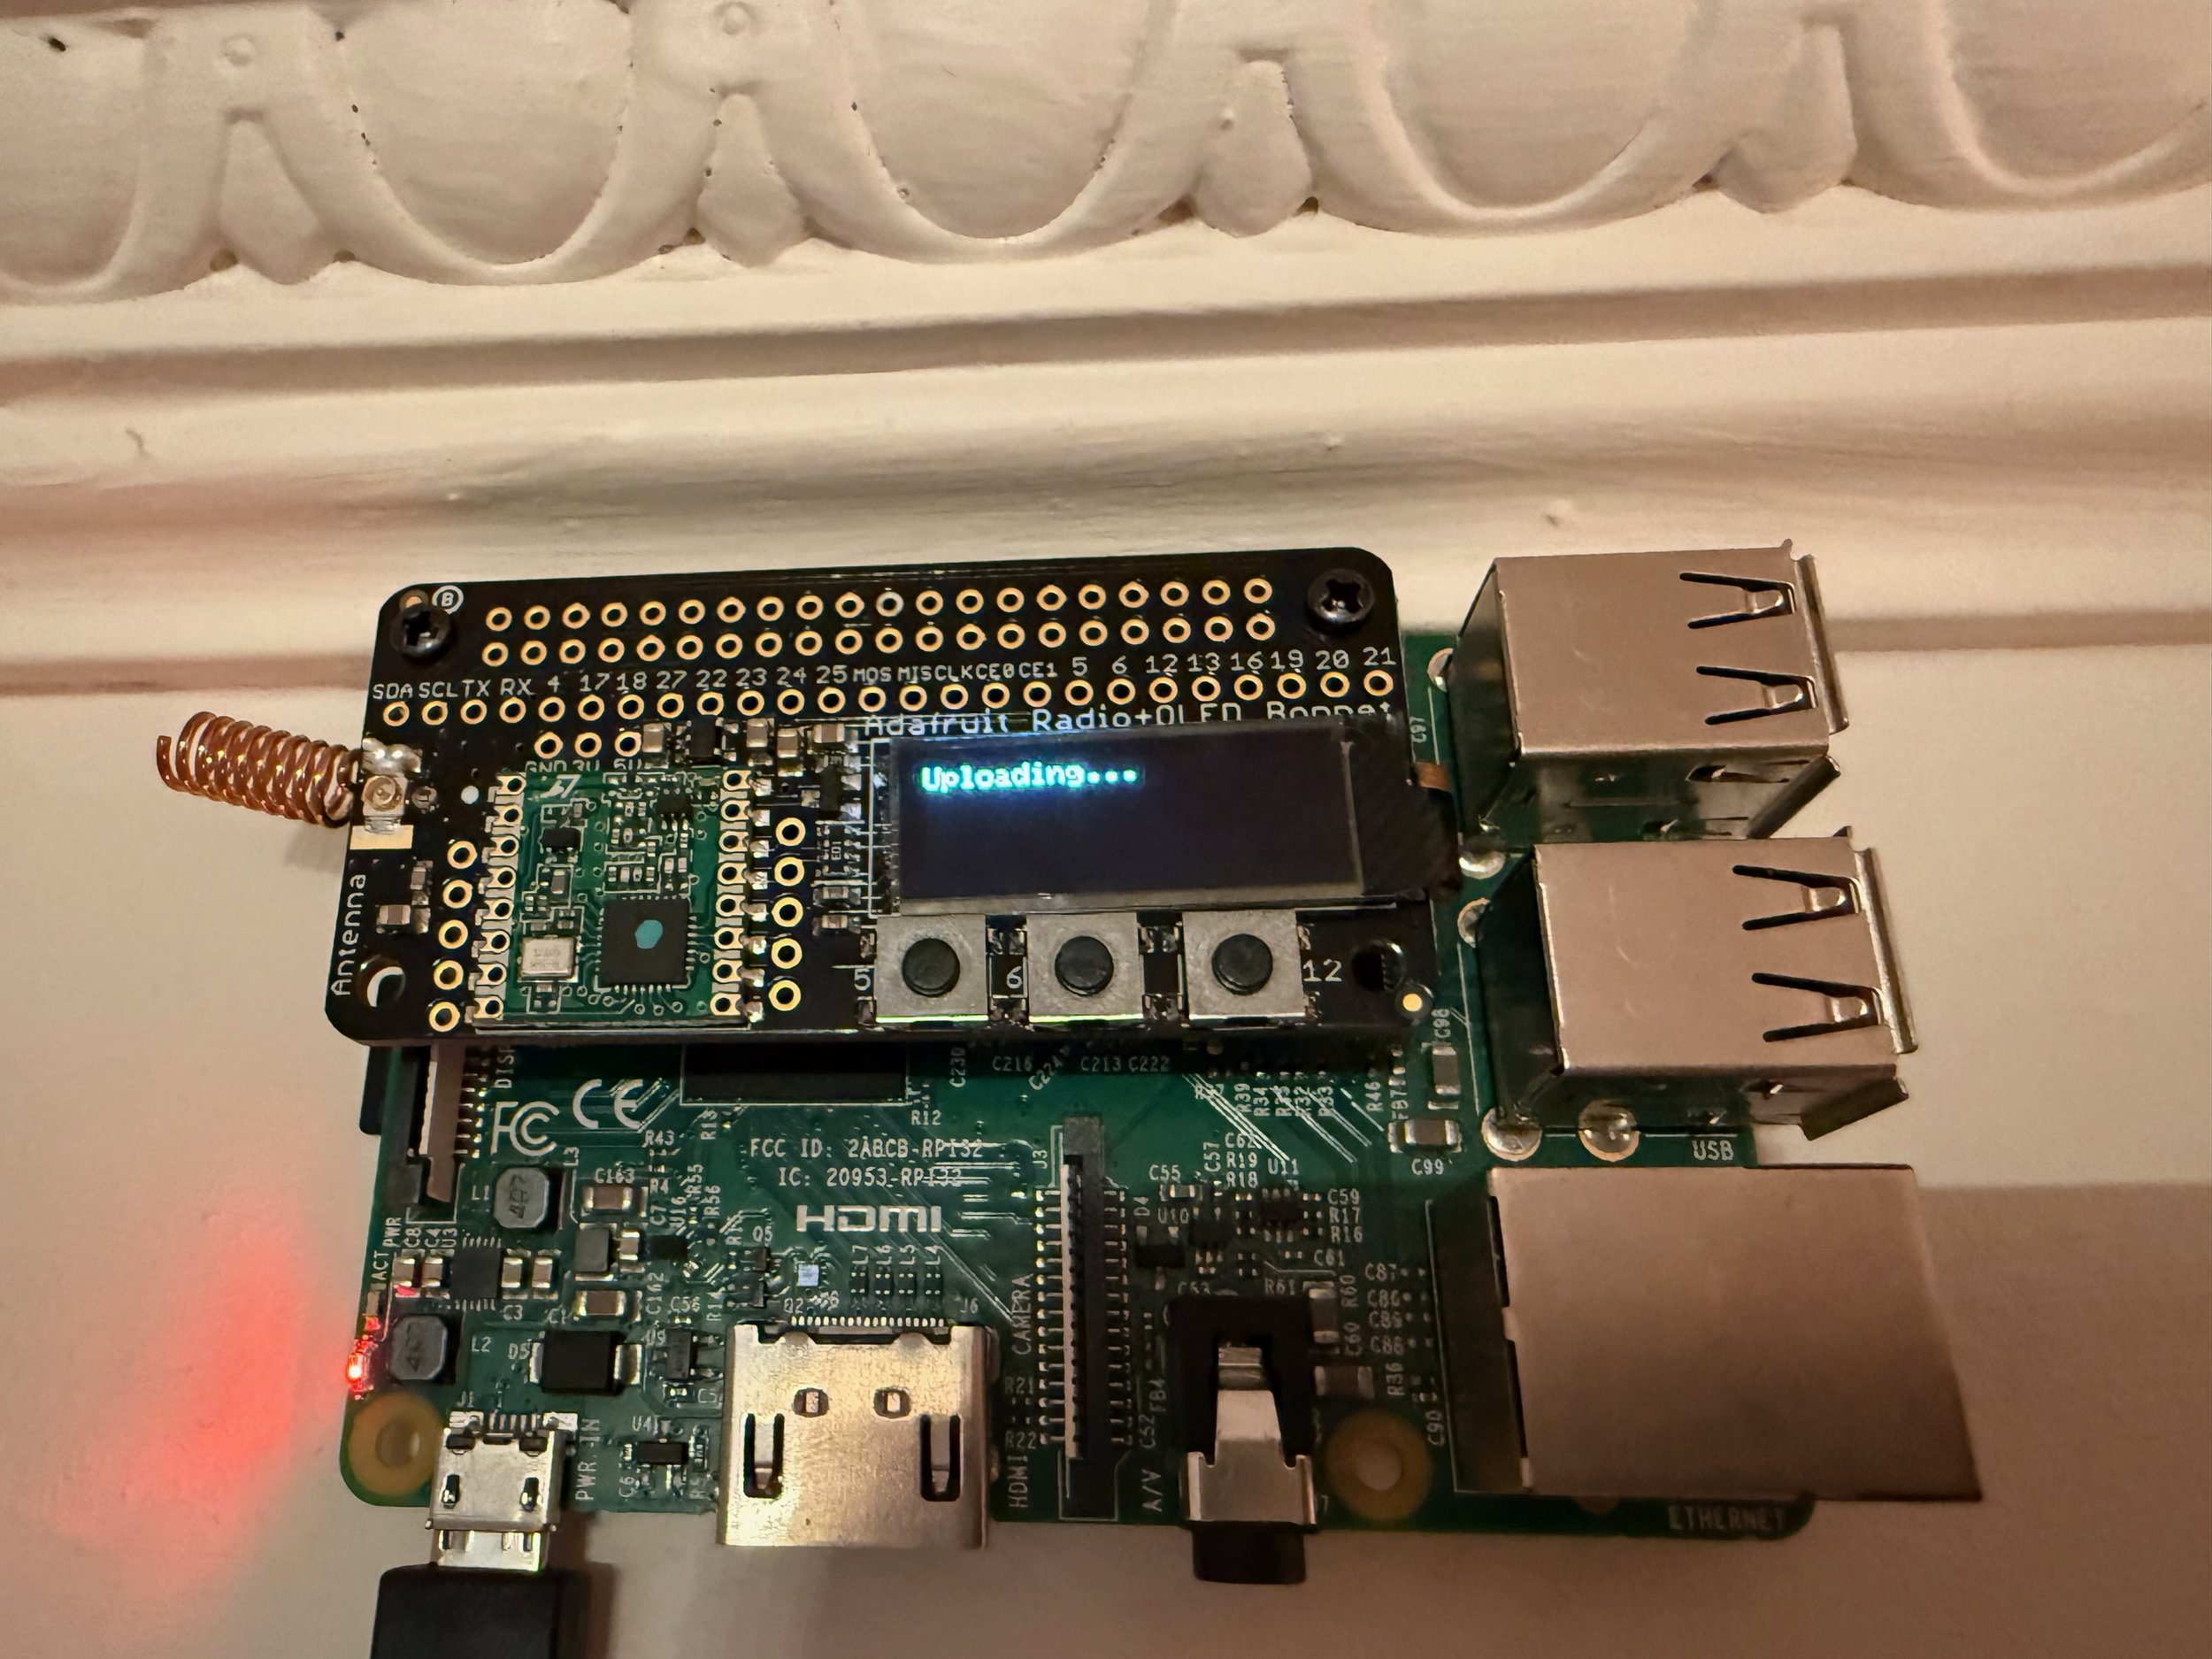
Whenever the weather station is receiving or uploading data, it’ll flash text on the screen. During the receiving of packets, it’ll show “RX 0”, “RX 1”, etc etc, then “Uploading…” when the packet is being sent to the API. It is a quick and easy visual confirmation when I’m in my apartment to know the station is continuing to work.
The buttons can also show screens on the receiver, but given this is mounted near my ceiling and I have tall ceilings…this feature gets used rarely, if at all.
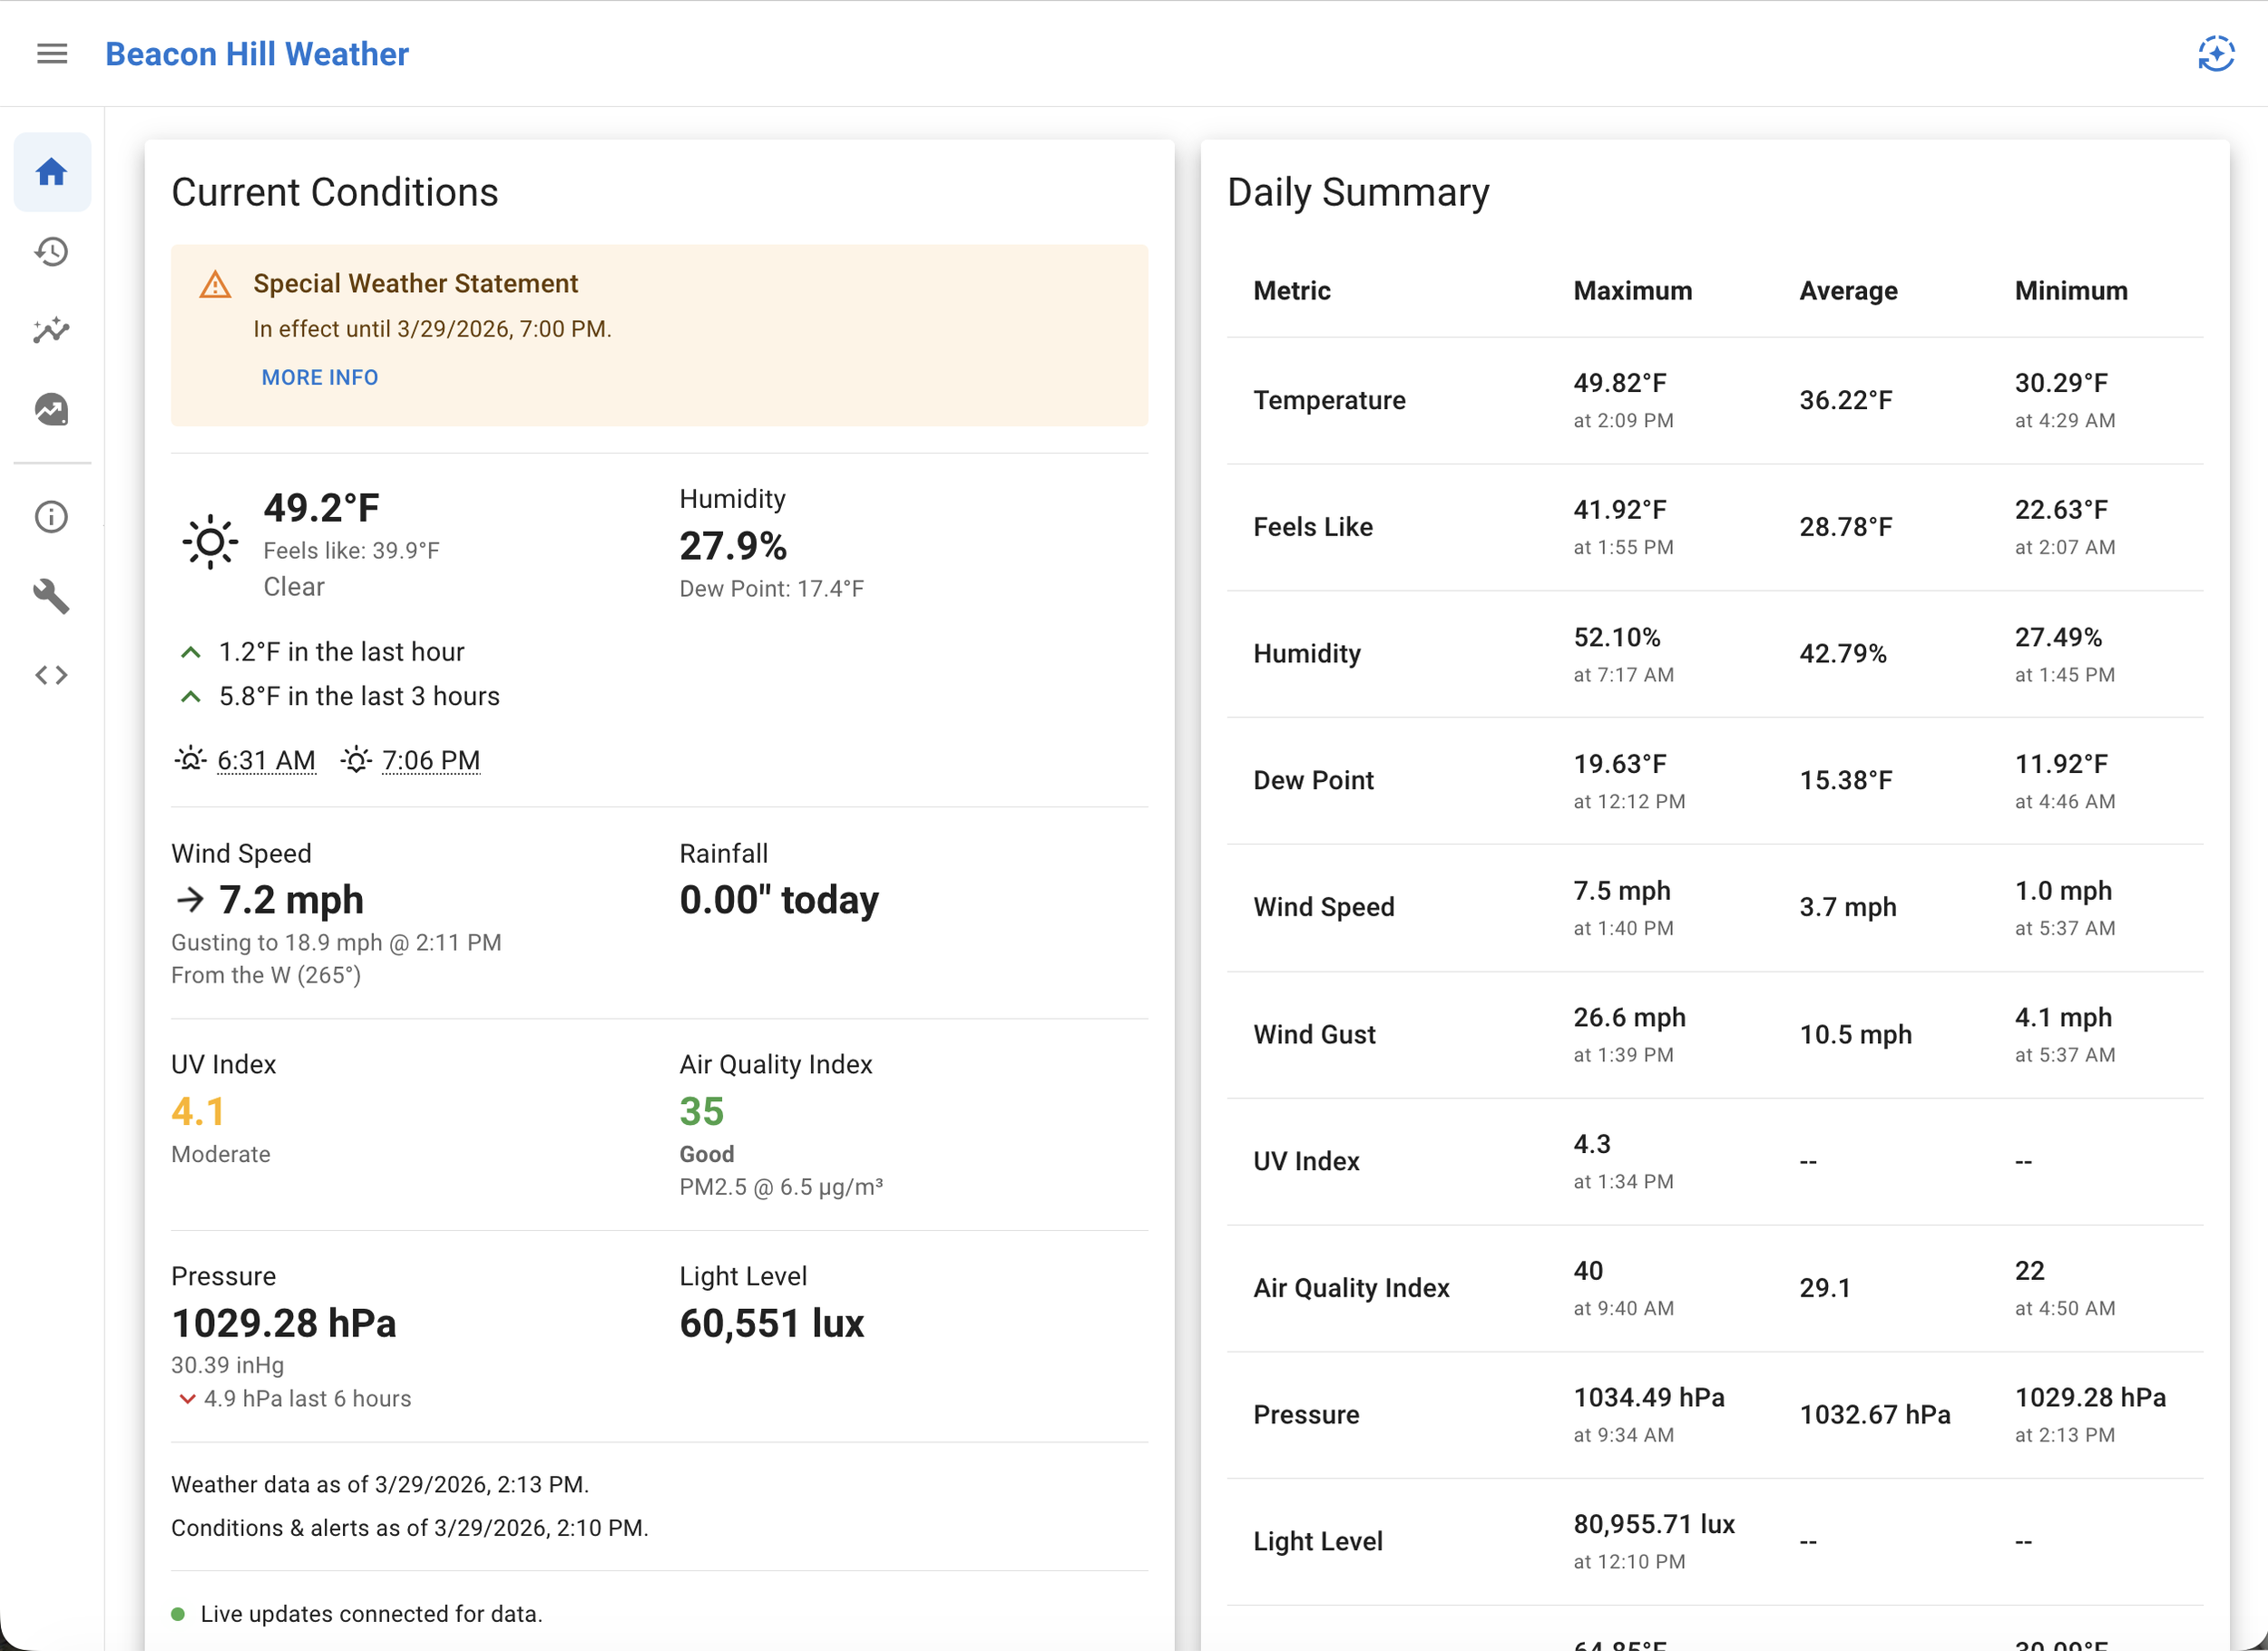
This is the main homepage of Beacon Hill Weather. The frontend uses React + MUI (a common combo), but with the Toolpad Core which helps with setting up this dashboard-style React app. Routing is done via React Router.
The homepage contains all the data of Beacon Hill Weather at a glance. The current condition (although when it’s raining, I populate the current condition based on rainfall rates), sunrise, and sunset times are fetched from Apple WeatherKit.
Below that is quite the data dump from every sensor & data point the station can collect, but it goes to show how much data this station is collecting (which is impressive).
On the right of the home page is the daily almanac, which shows (in a very big table that will hopefully go the way of the dodo for something better) the max, avg, and min of a variety of data points for the day.
The homepage also shows NWS alerts when they are active for the region that Beacon Hill Weather is in, along with system-level alerts before the current conditions box when they are active (mostly used for maintenance alerts).
Data is refreshed via websocket, but can fall back to the old interval-based refreshing system if needed.
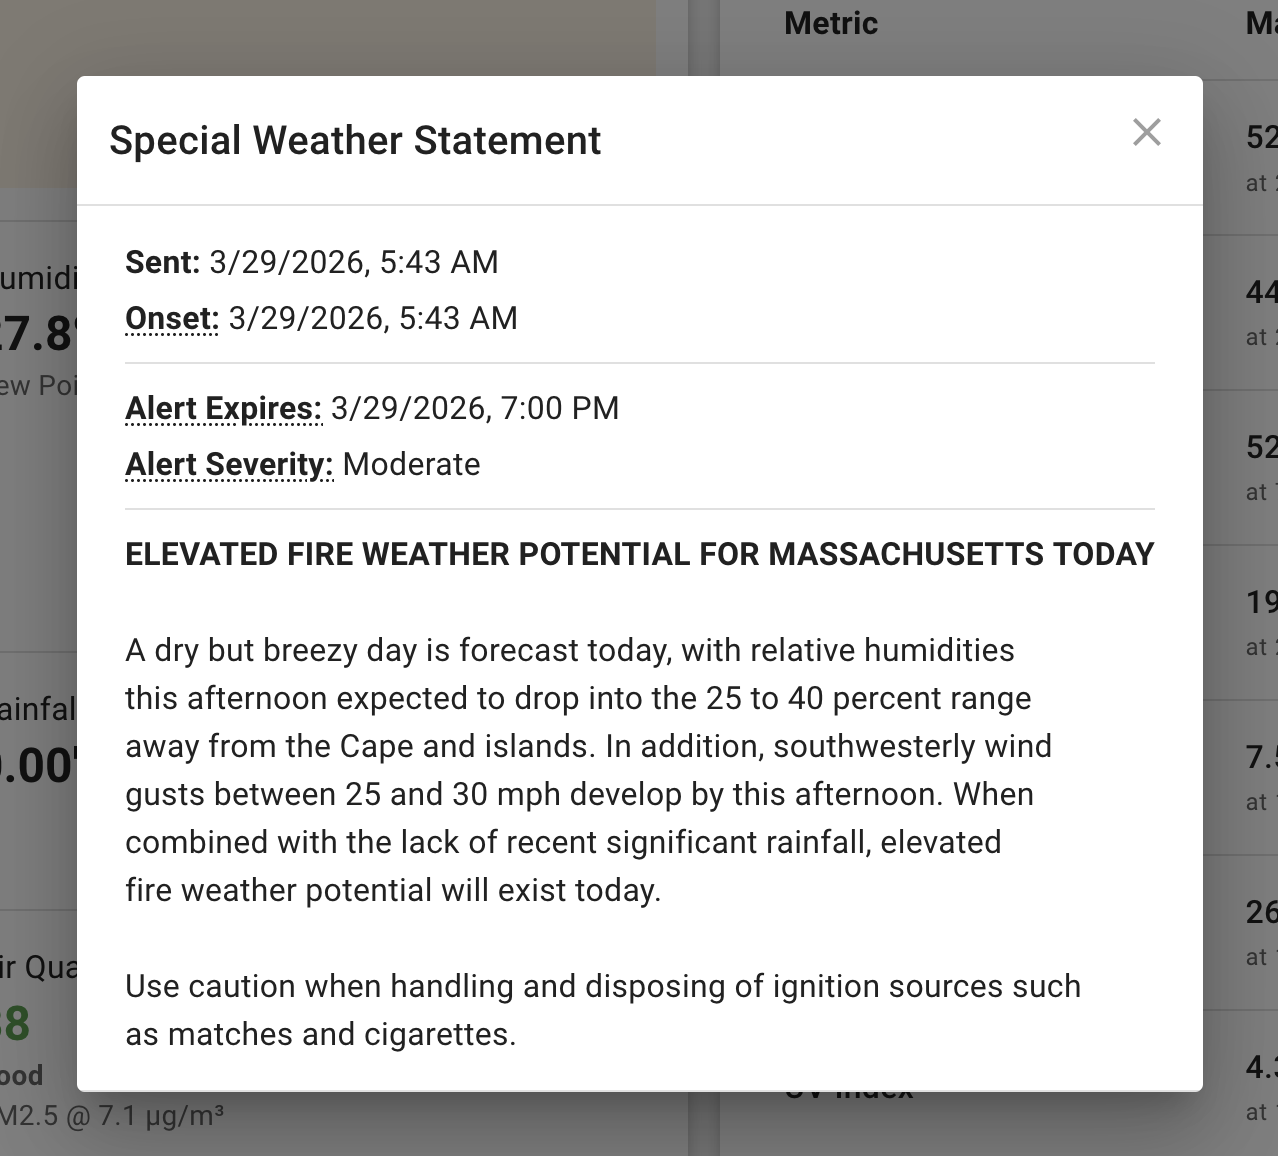
When clicking on any NWS alert’s more info button, a modal pops up that shows you details about when the alert was sent, the onset time, expiry data, and severity. The alert text is also shown verbatim from the NWS.
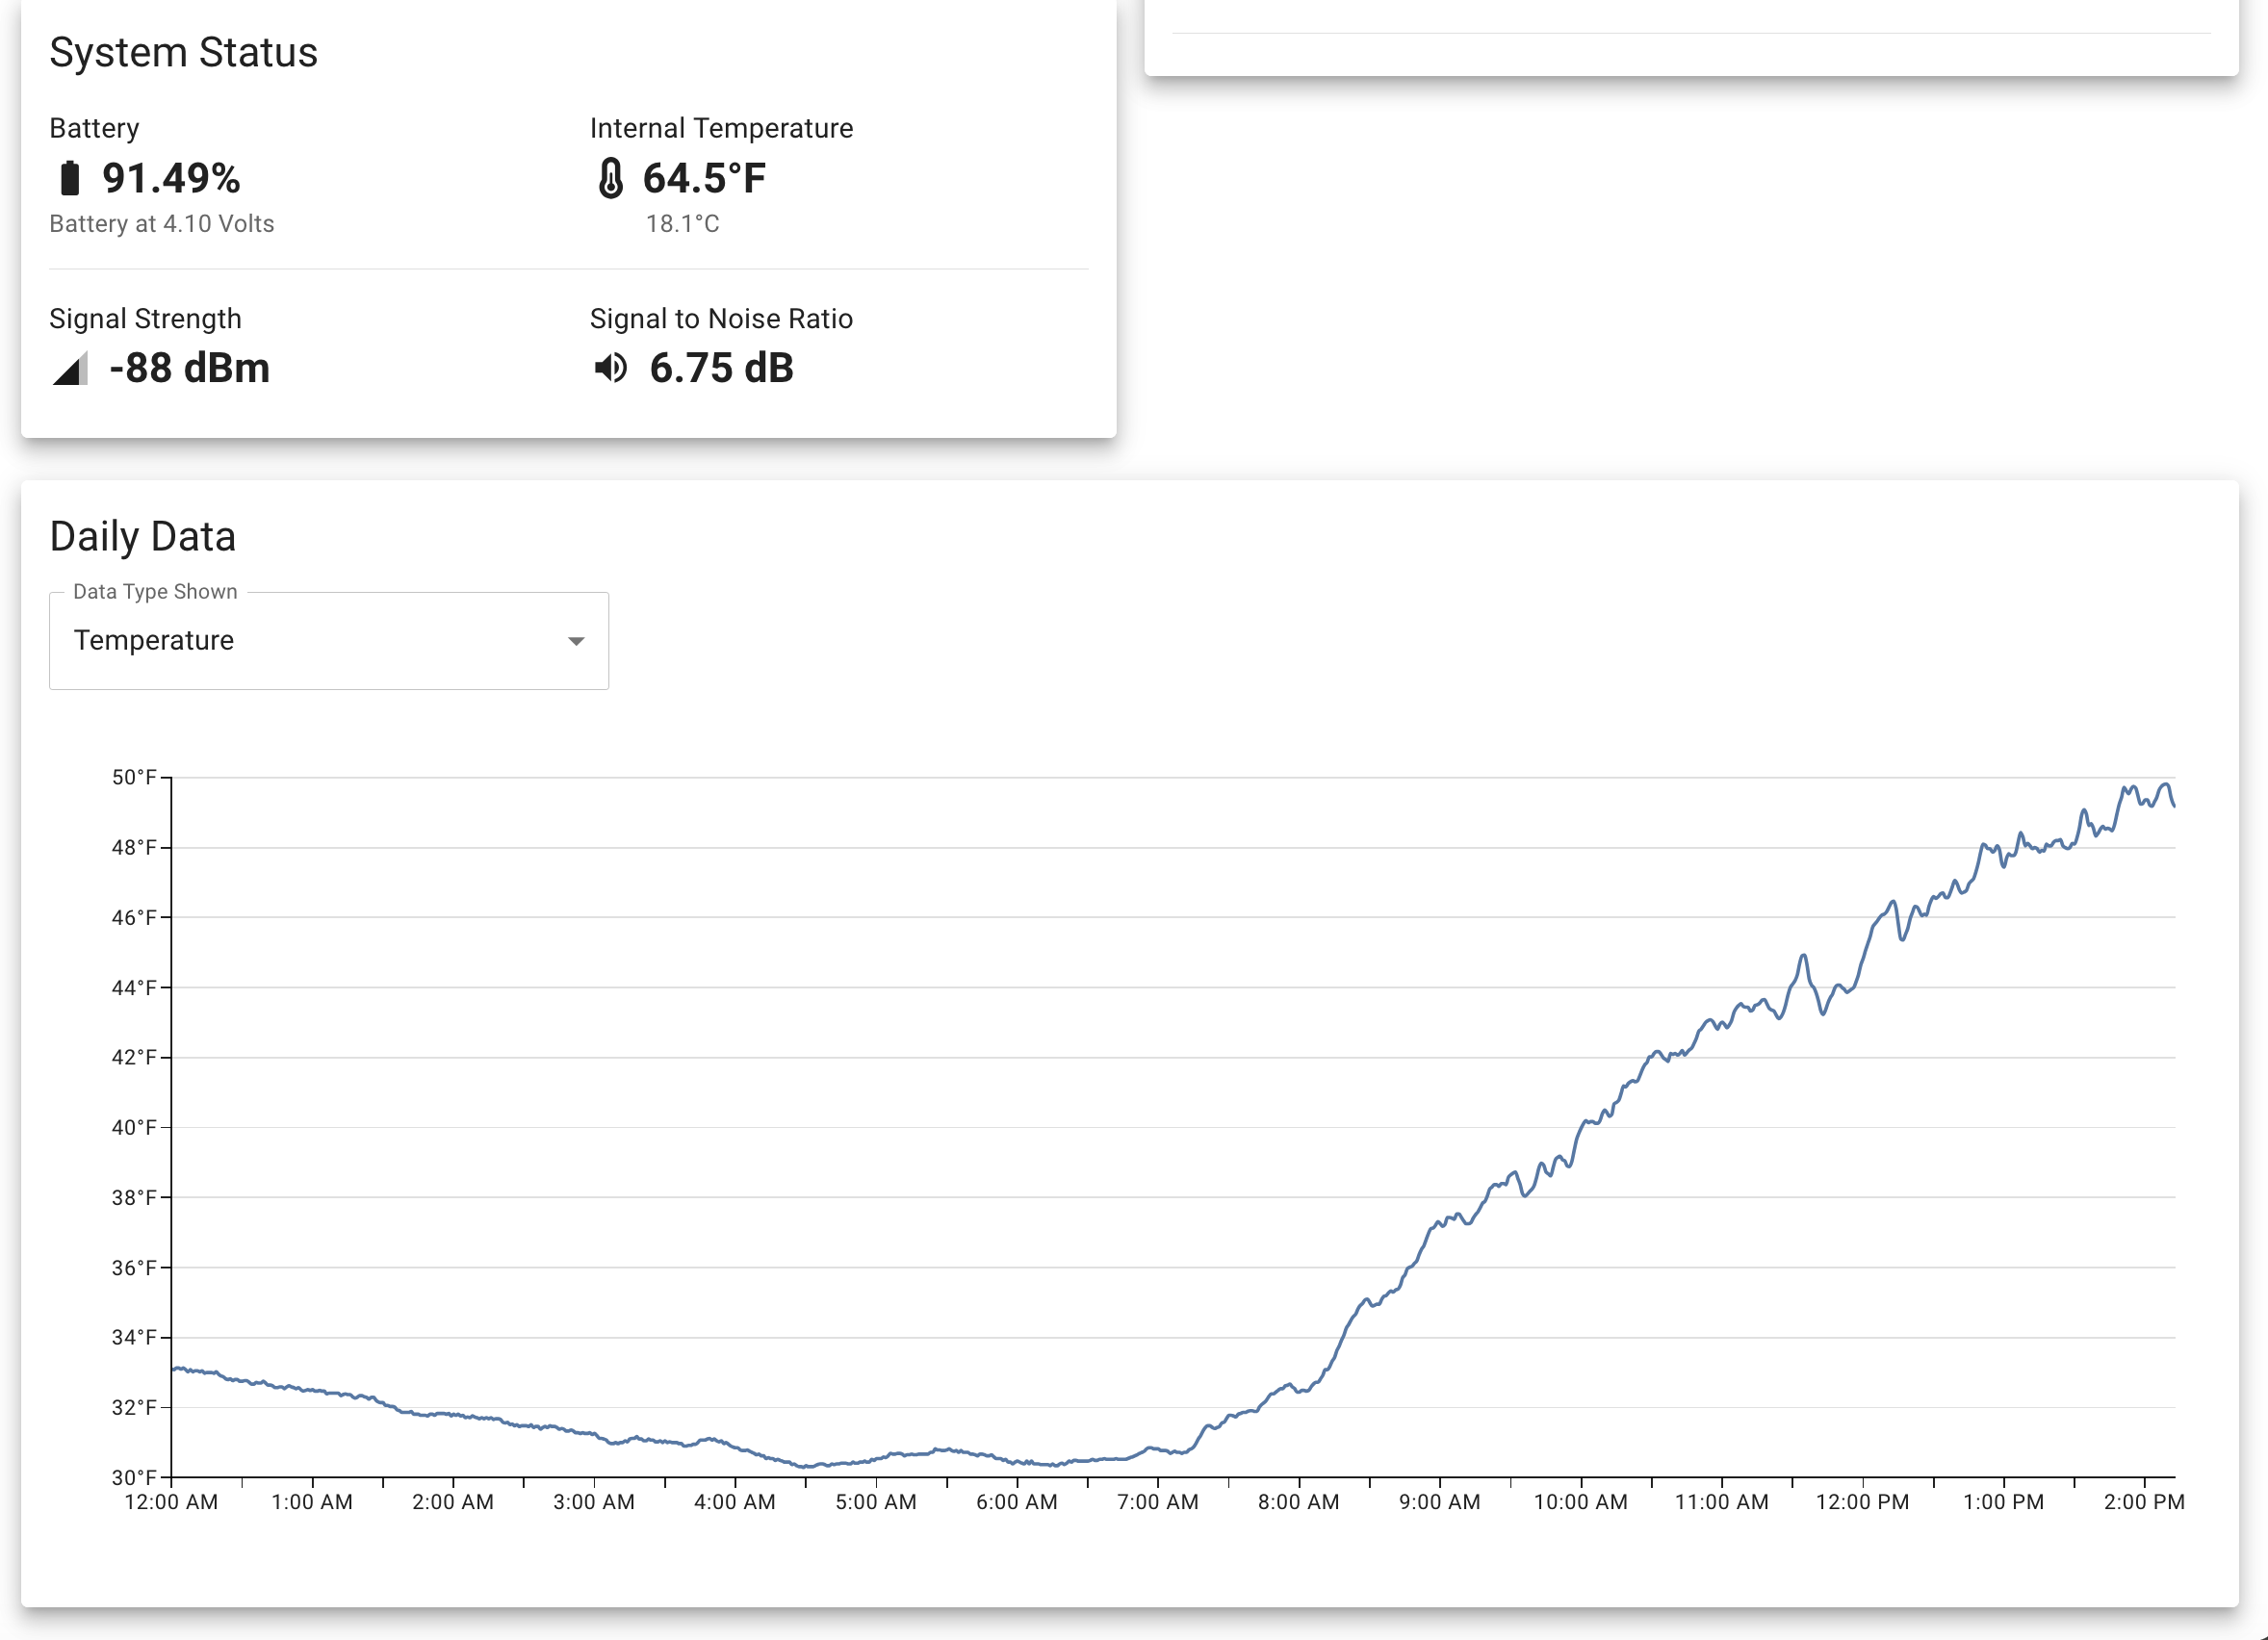
Below that on the homepage is the system status box, which shows the battery level, internal tempeature, signal strength, and SNR at a glance.
Finally - the daily data graph shows all the data points collected during the day, with a select dropdown to choose from lots of data categories (humidity, dew point, rainfall, wind speed, the list goes on).
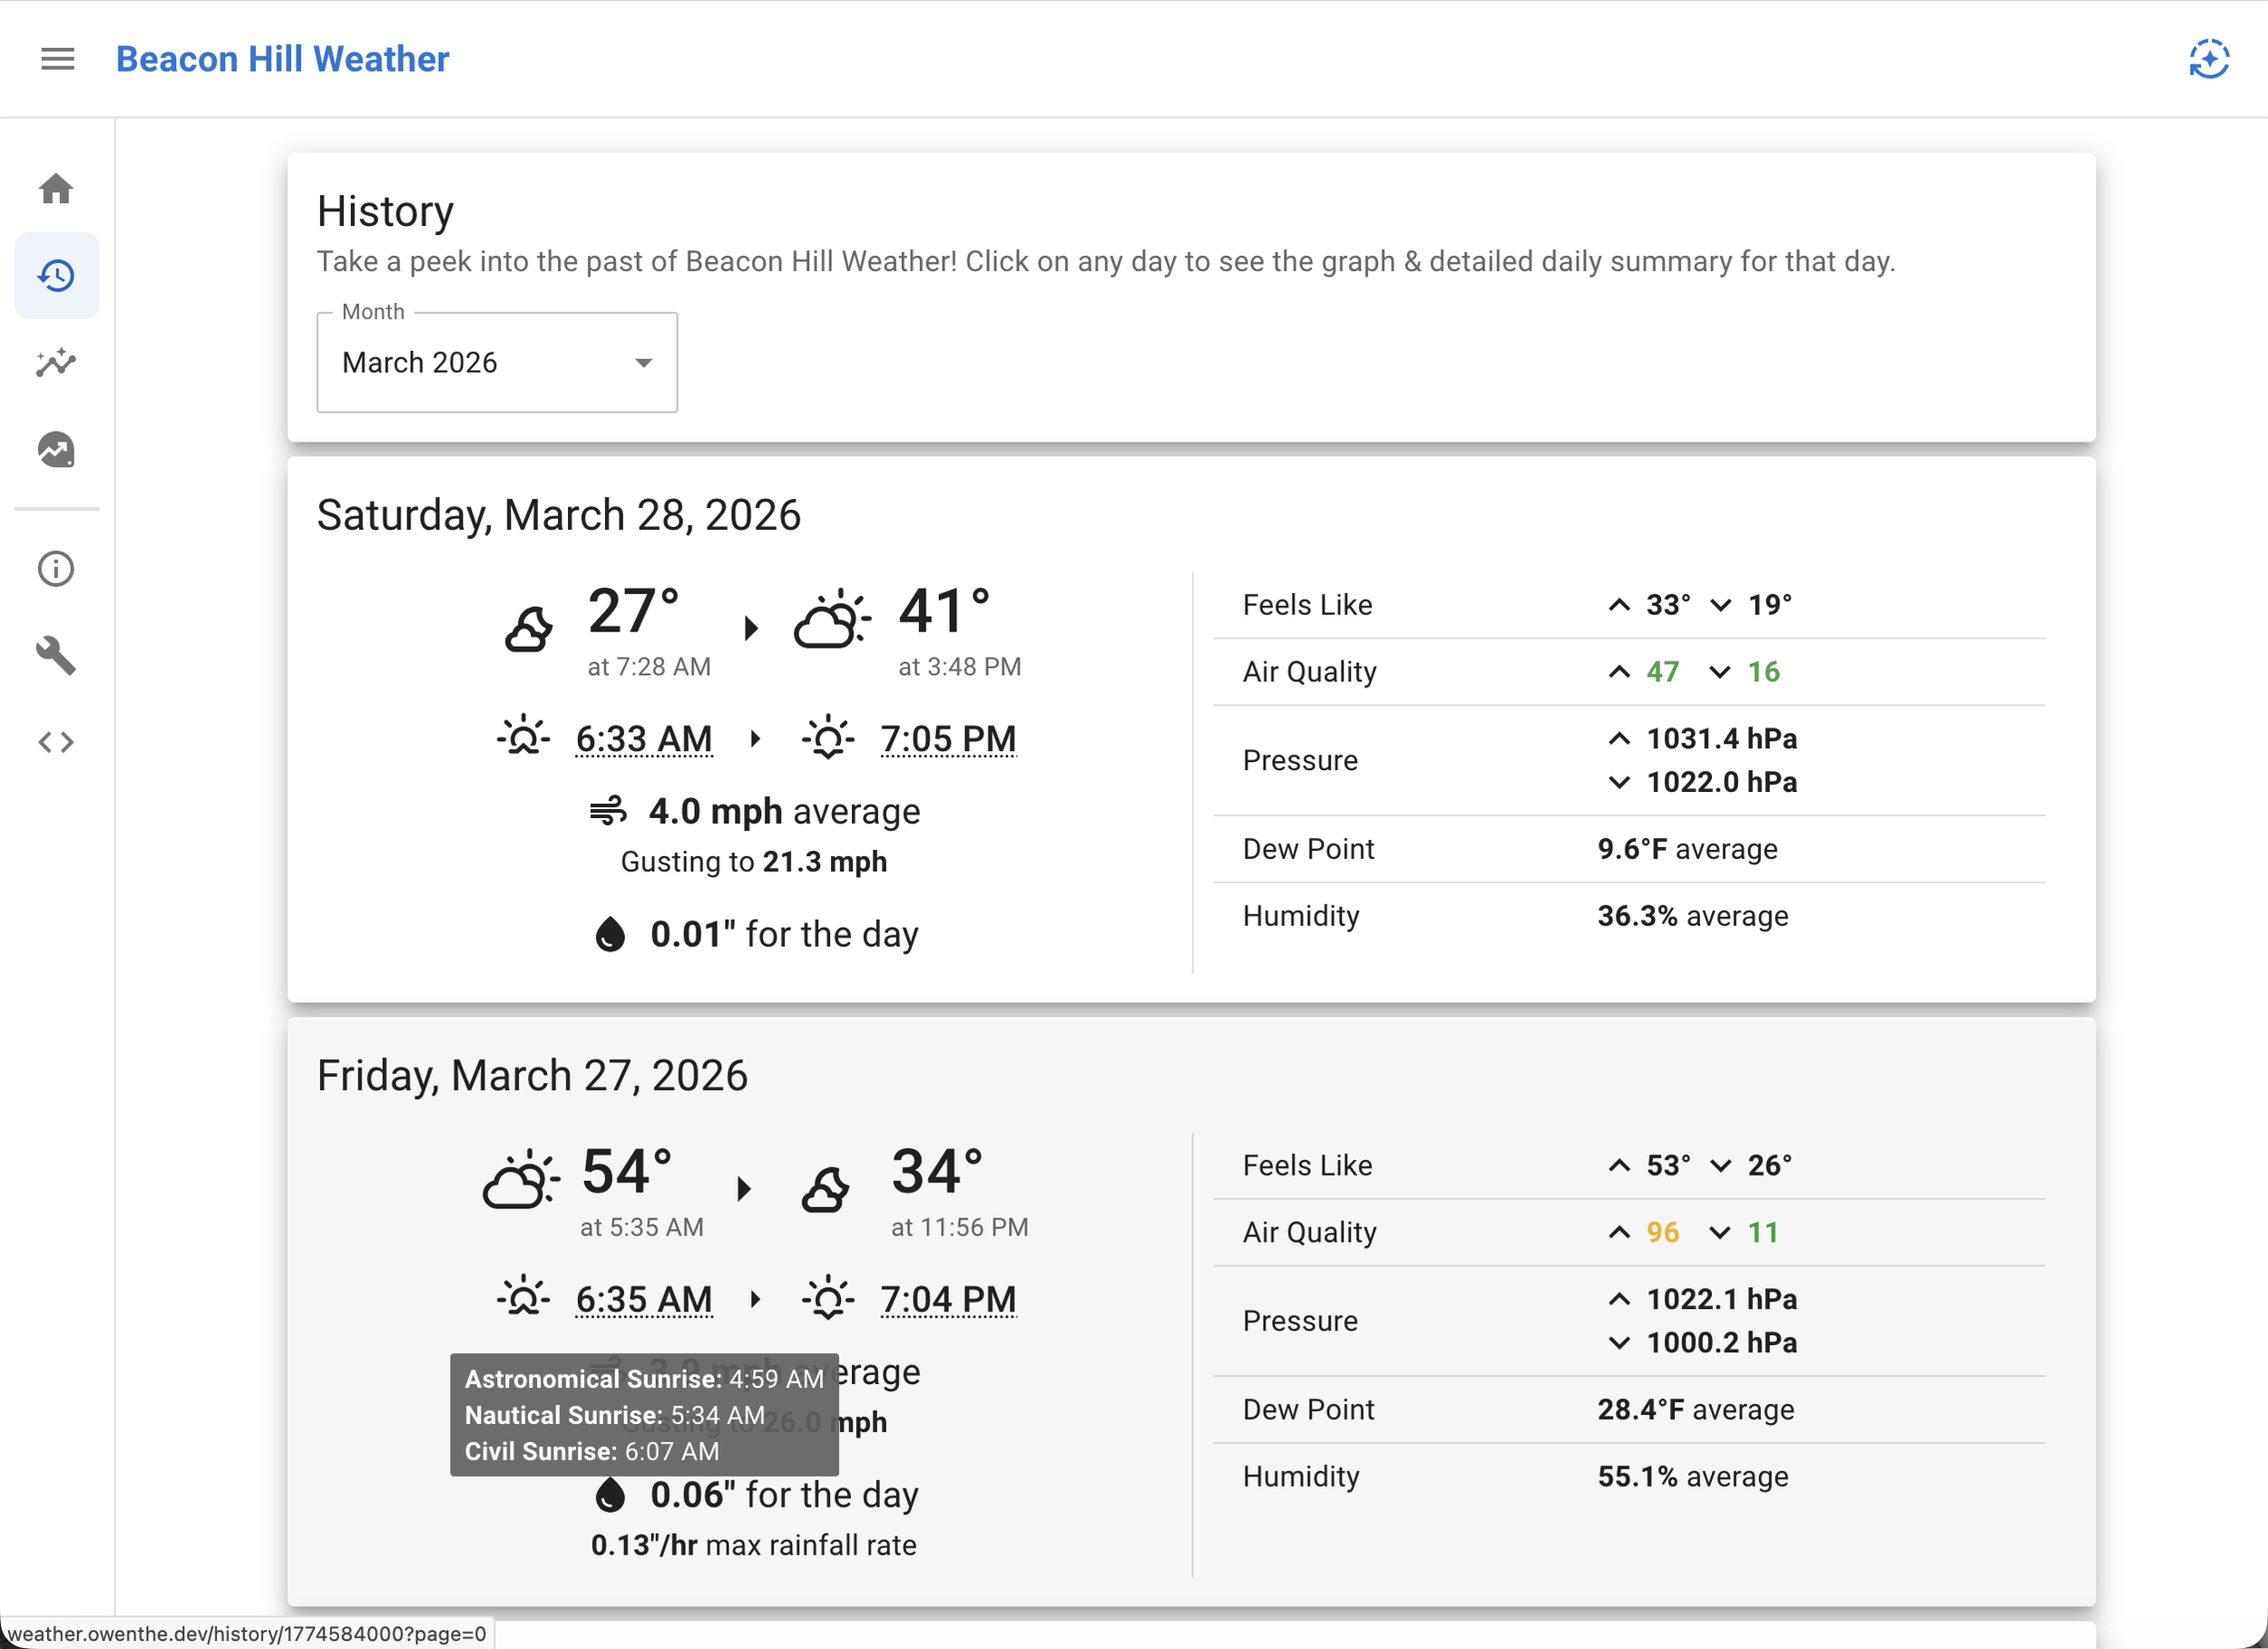
The next page on Beacon Hill Weather is the history page, which allows you to see a day-by-day history of every day that has been recorded on the station. At the top, you can select by month, and go from there with all the days.
Each card shows the max & min temperature, sunrise & sunset times (additional times can be shown by hovering over one), wind speed average & max, rain/snowfall (and rainfall rate max), along with more data on the right.
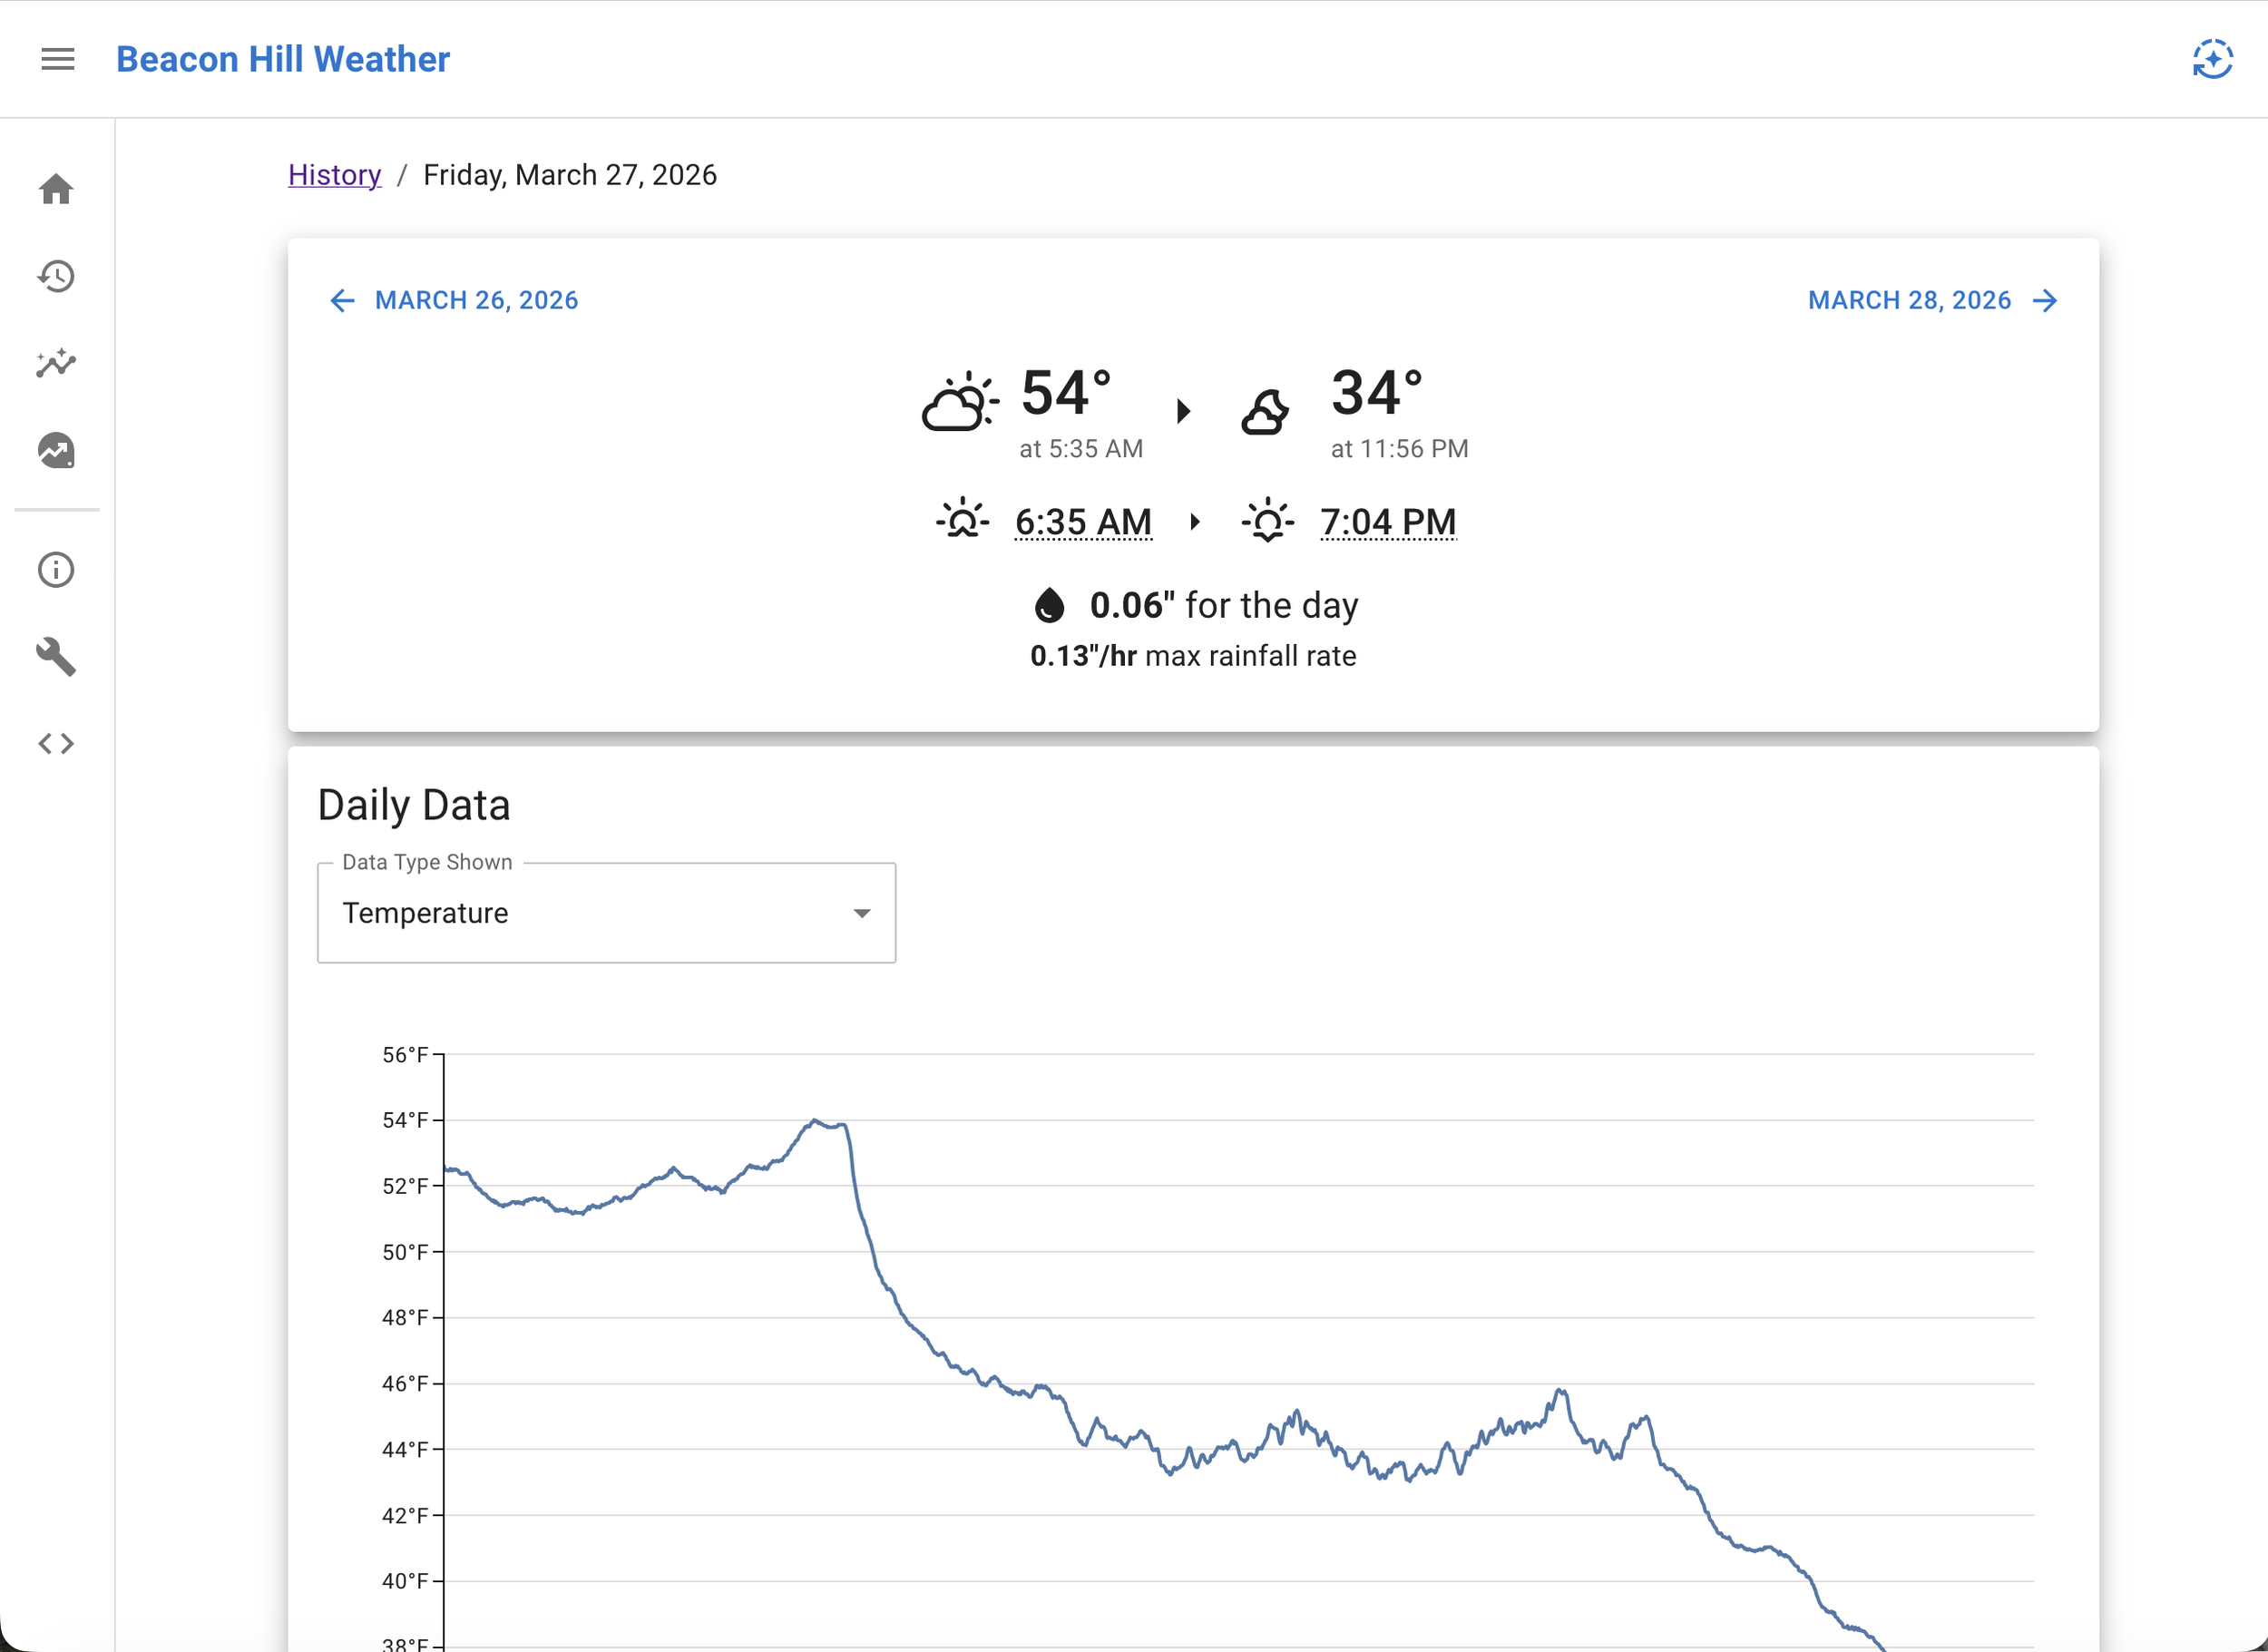
Clicking on any history page card opens the detailed page for that specific day. At the top, links to the previous & next days are provided for easy inter-day navigation. Below that is a repeat of the card on the history page.
Finally, a graph for all the daily data is provided, and below that is another almanac table that’s identical to the one on the homepage (just with a different title).
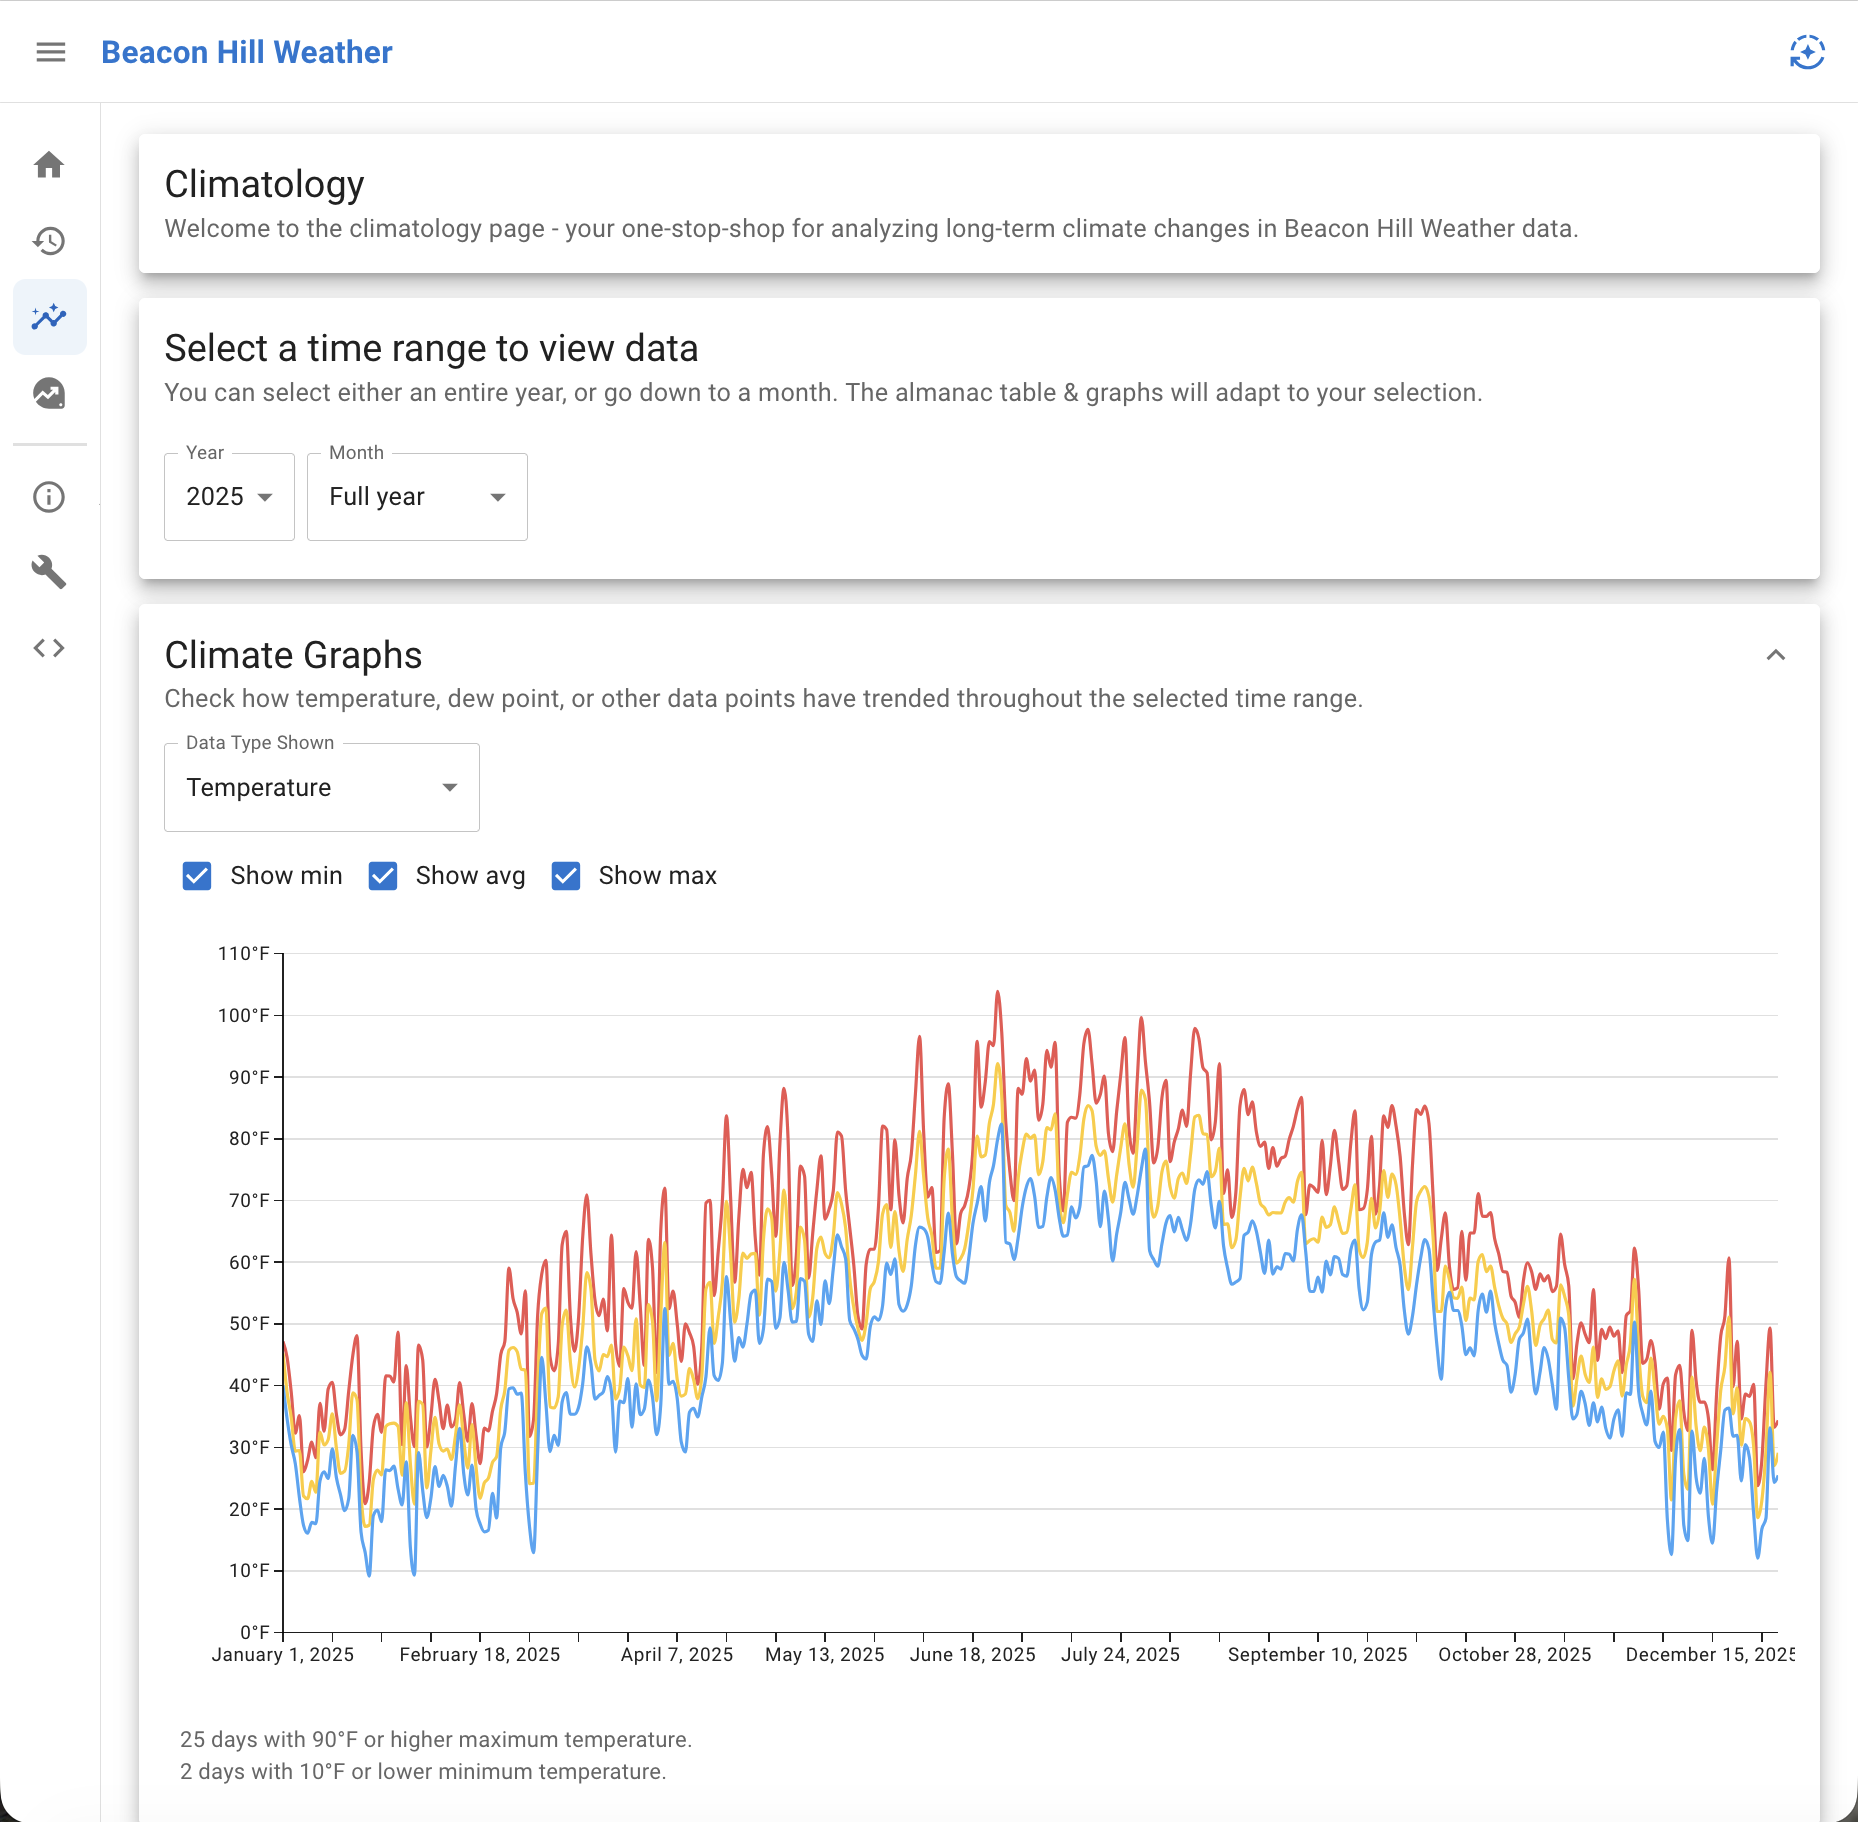
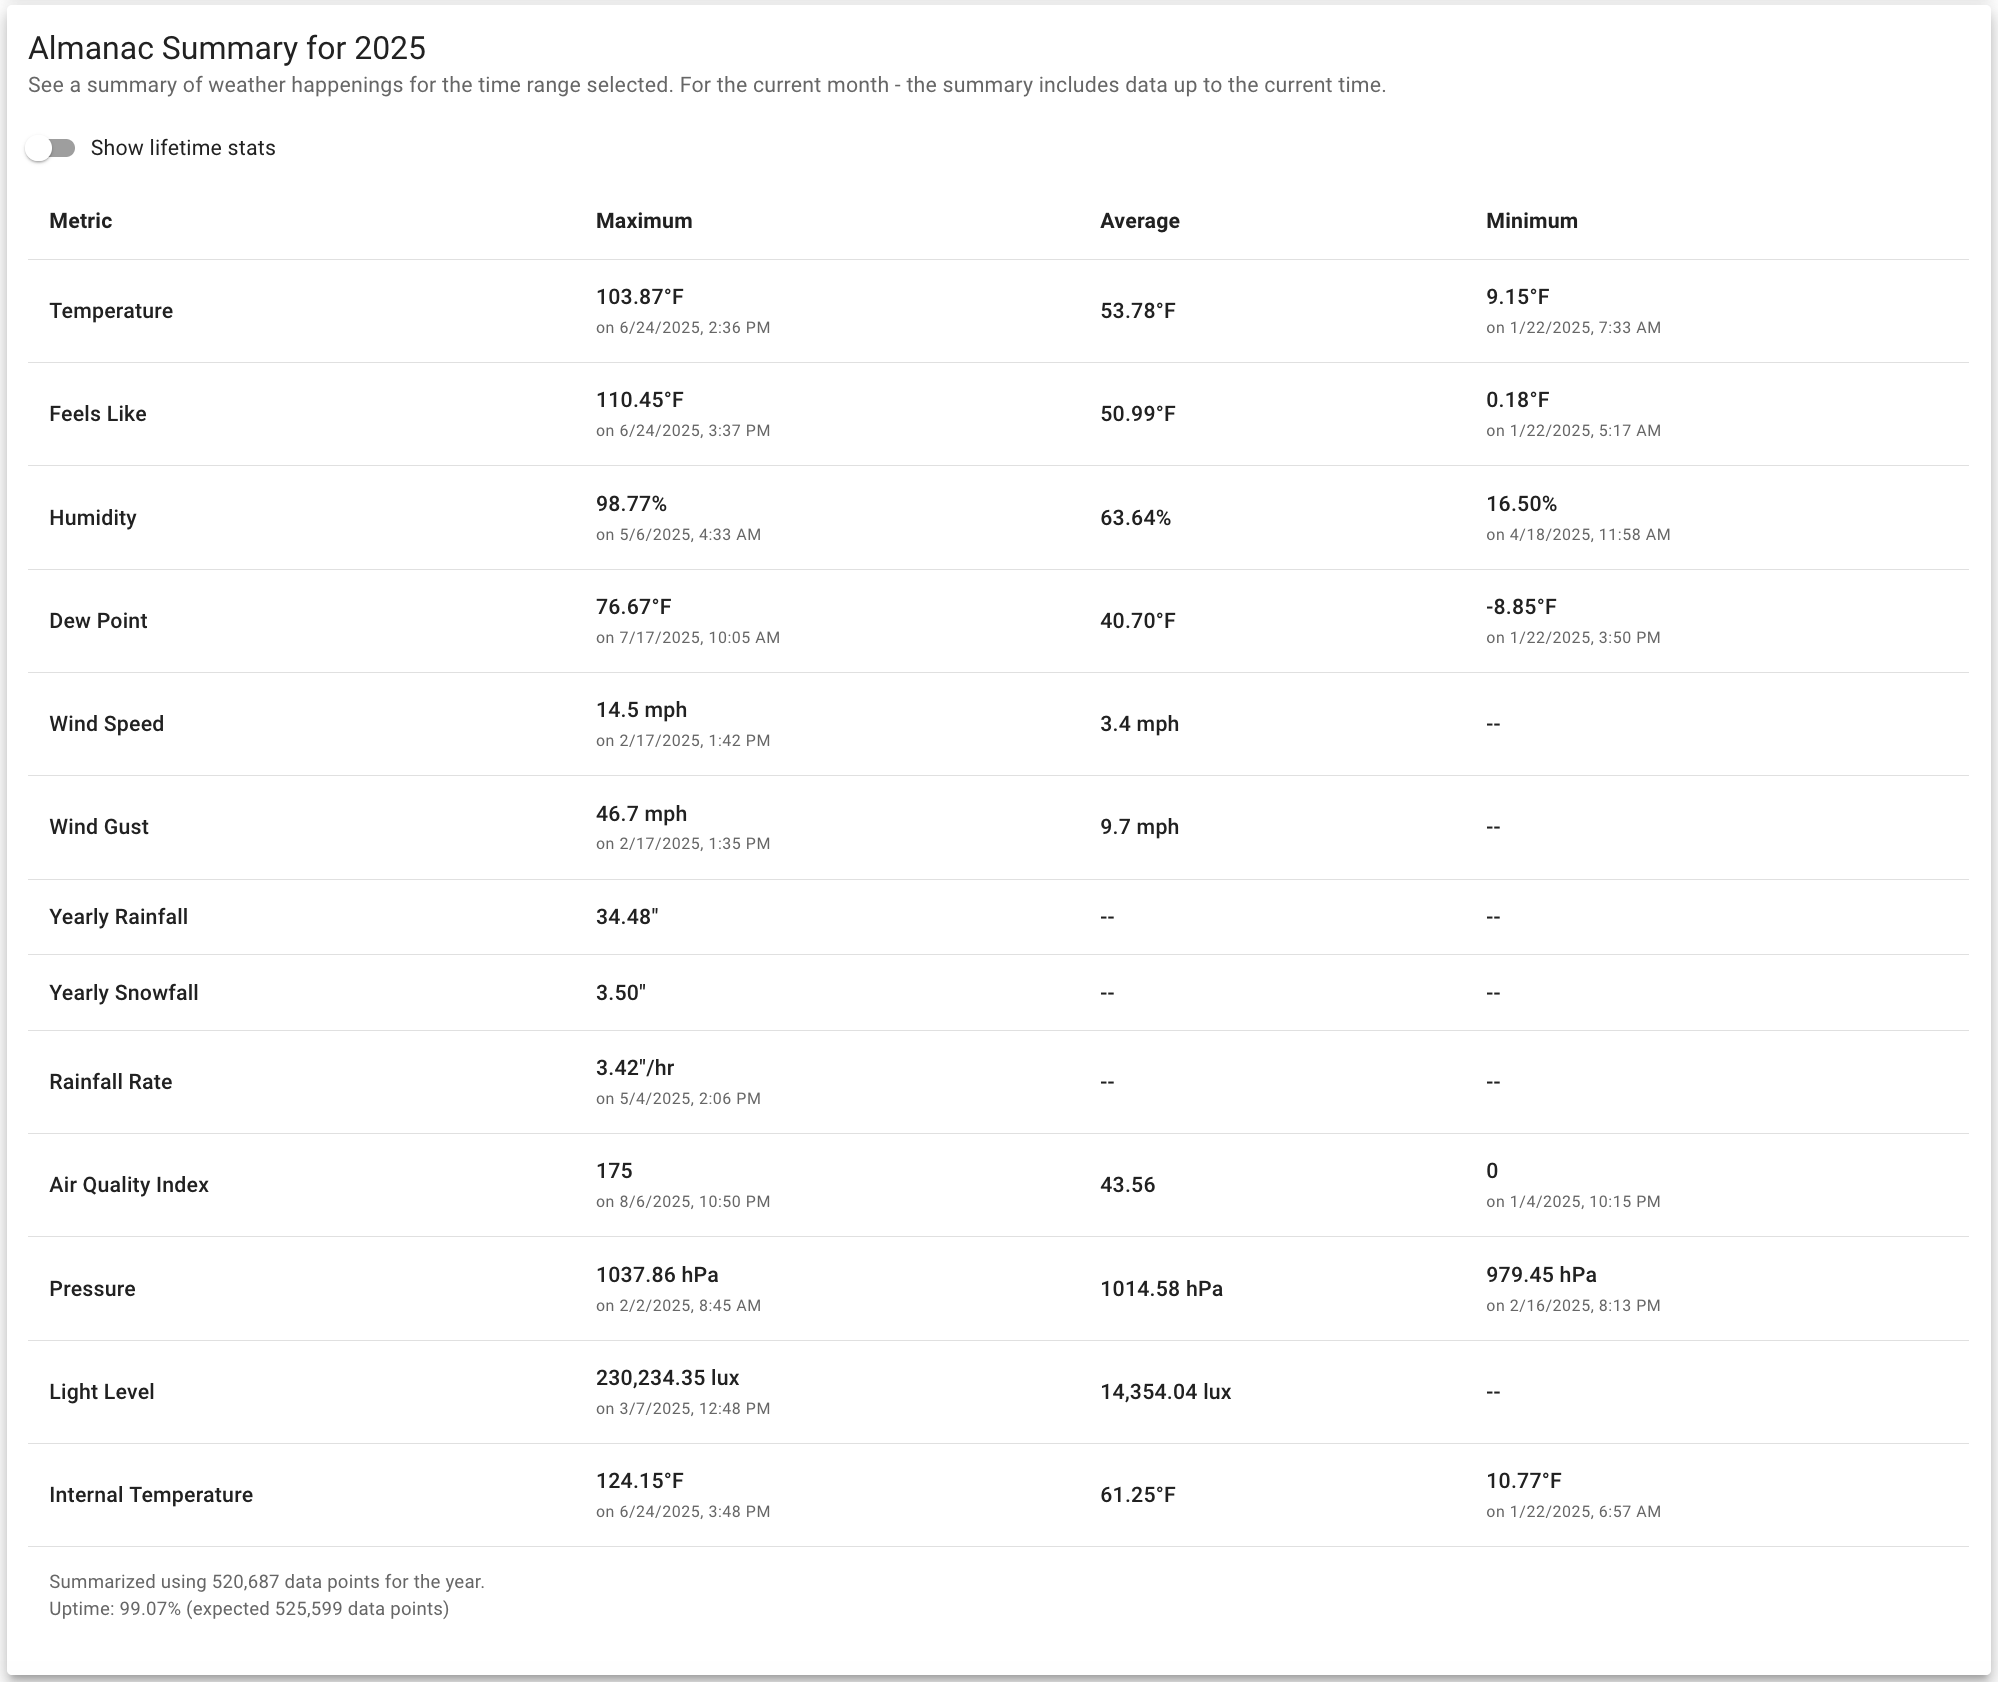
Next up is the climatology page, which is intended to allow users to see long-term climate data from Beacon Hill Weather. It starts off by showing the full-year chart of the current year, but I wanted to show the 2025 climate chart of the temperature (which is very cool!).
You can narrow down your year & month selection by using the two dropdowns in the first box - this affects the graph & another almanac table below the chart.
The graph shows the max, avg, and min color-coded as different lines. You can easily turn the series off with checkboxes, and another dropdown for data type is available to see humidity, dew point, wind speed, pressure trends, or show bar charts for daily snowfall/rainfall.
The almanac table below this also has a switch to see lifetime stats, which is pretty nifty.
Here is a screenshot of the Almanac Summary table for 2025. Very cool, very nifty, but this table is gigantic. I’m hoping to add some sliders with color ranges to make this look a lot better.
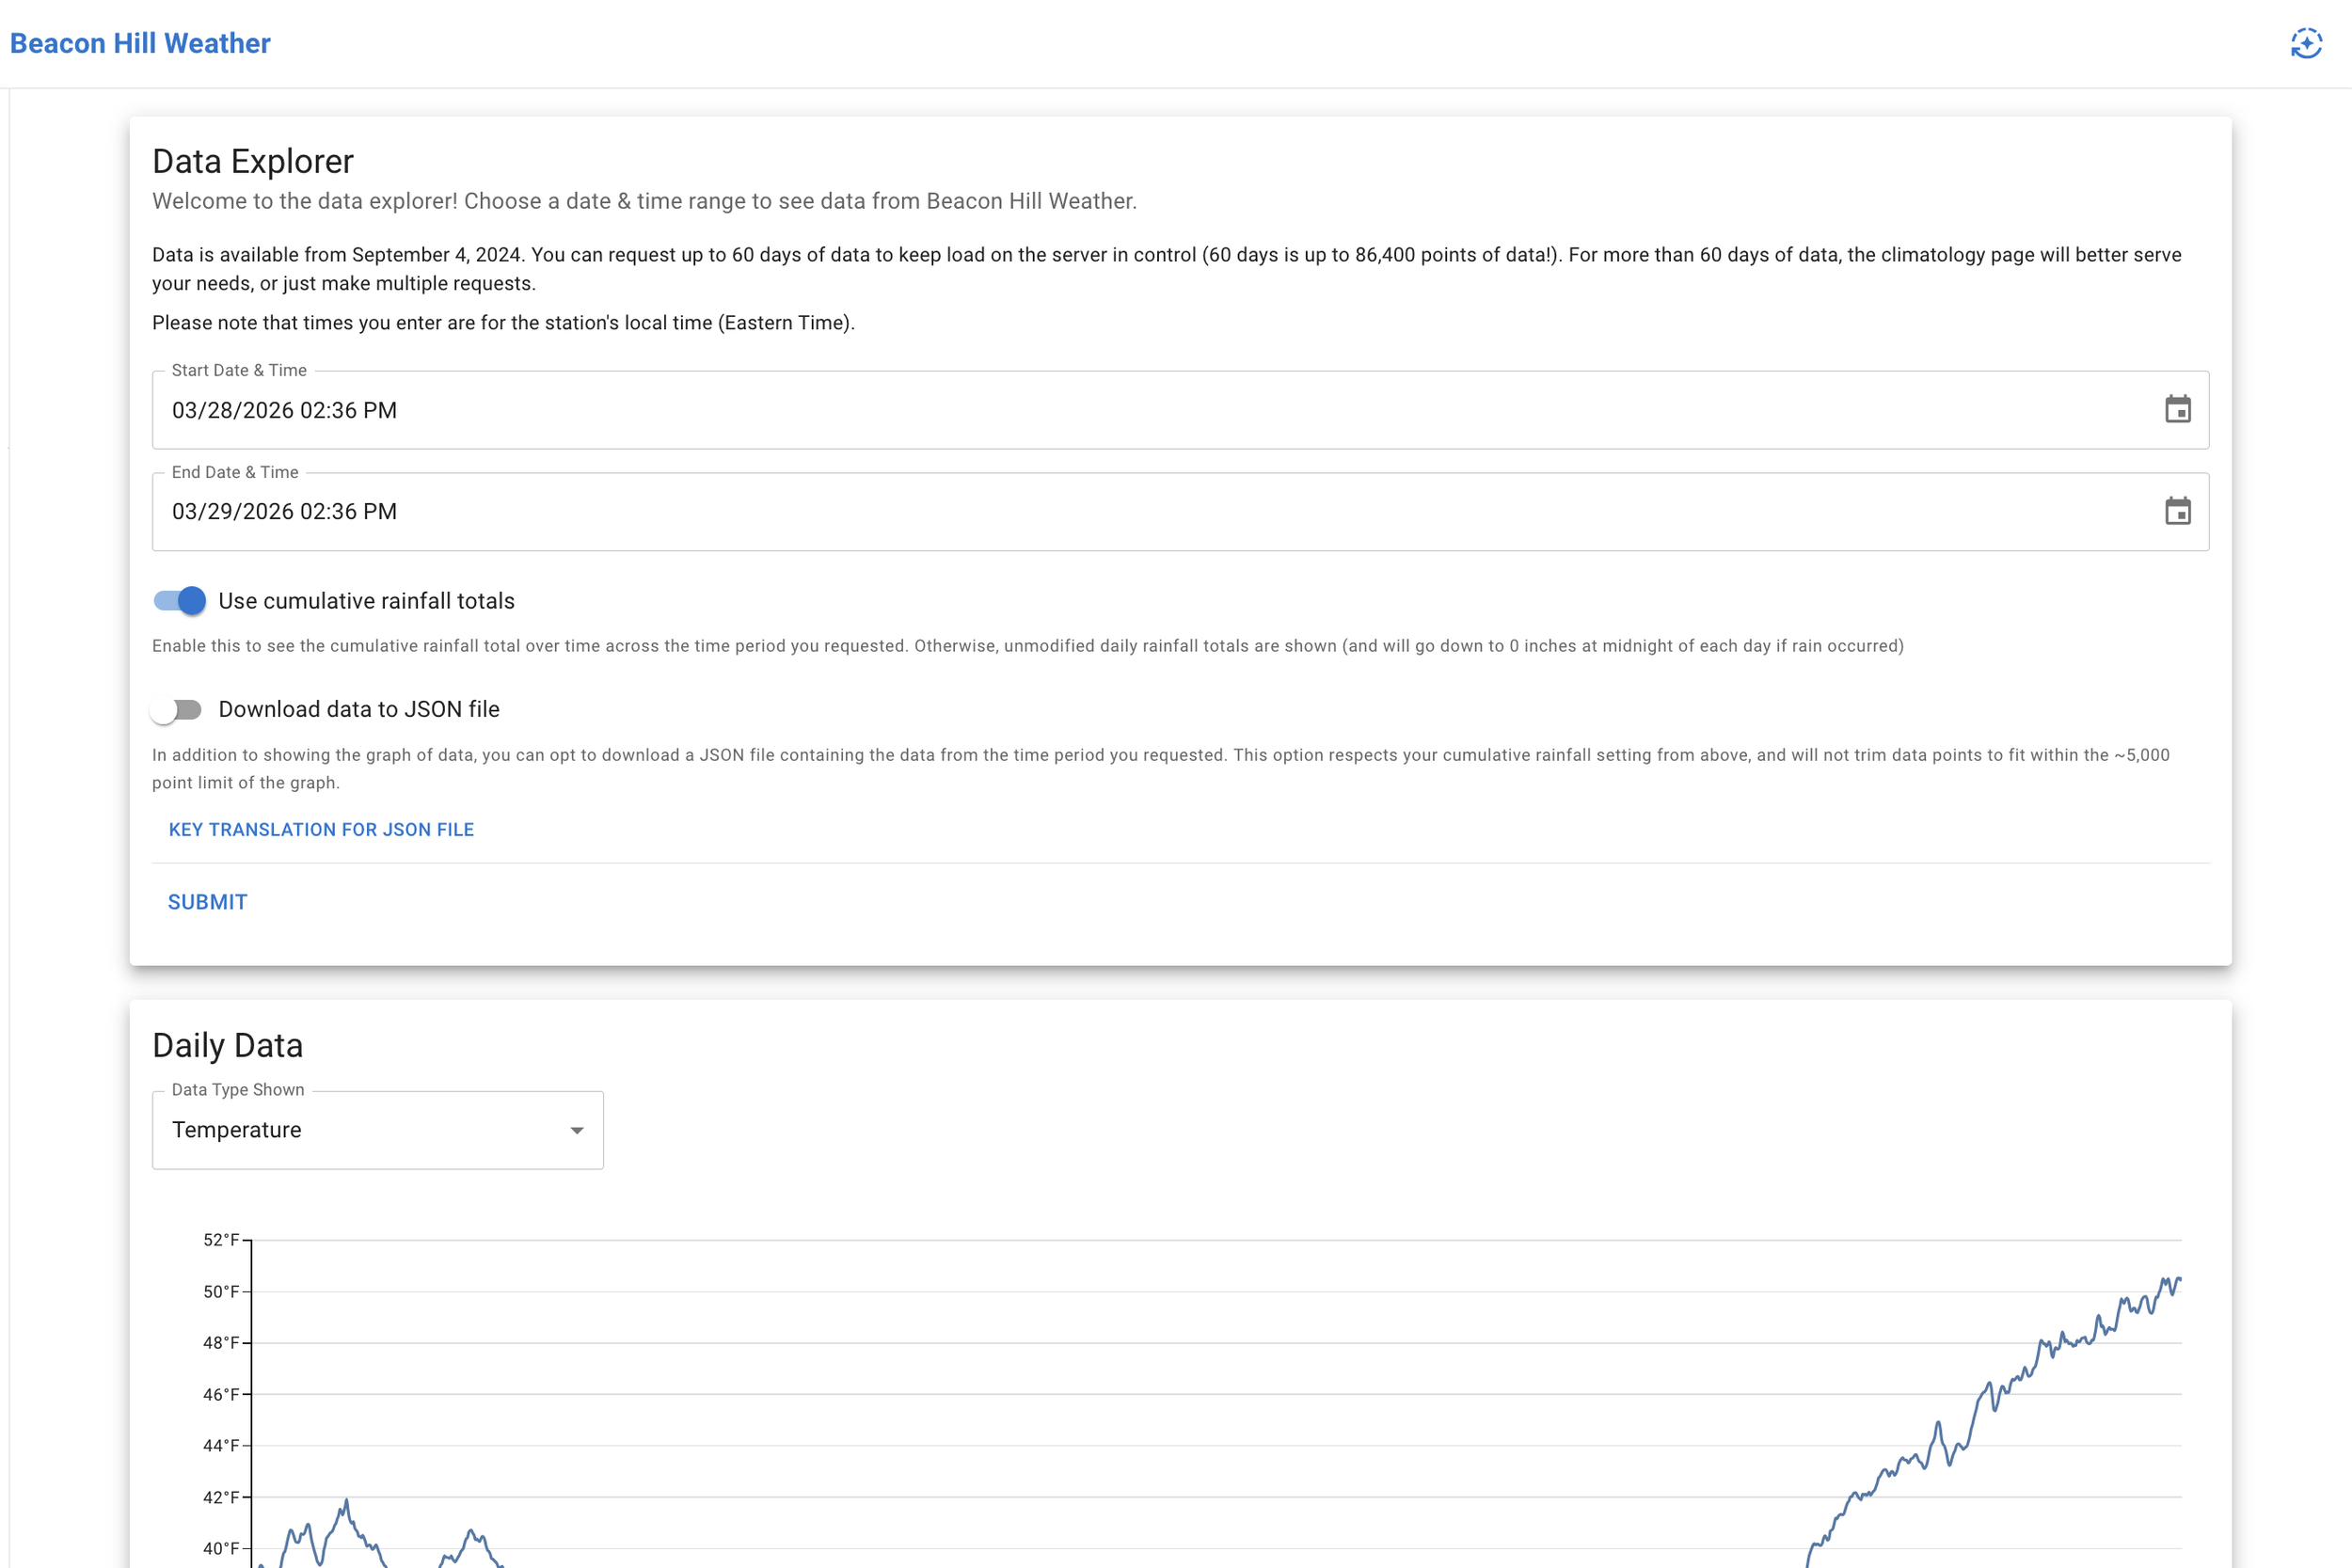
The next page on Beacon Hill Weather is the data explorer page. This is where anyone can query data from Beacon Hill Weather for any time range, up to 60 days (to prevent my server from exploding with all the Pydantic validations). Once you hit submit, away you go, and you get a lovely graph with another dropdown to select from 9 million data types.
This page has a couple cool features where it can use cumulative rainfall/snowfall totals rather than going by day (since the count resets to 0 at midnight), and dumping to a JSON file if you’d like.
The next three pages on the sidebar (below the divider) are basically support pages for the entire website.
The about page does exactly what it says - it tells you about Beacon Hill Weather in excruciating technical detail. I’ll spare you that on my portfolio entry though.
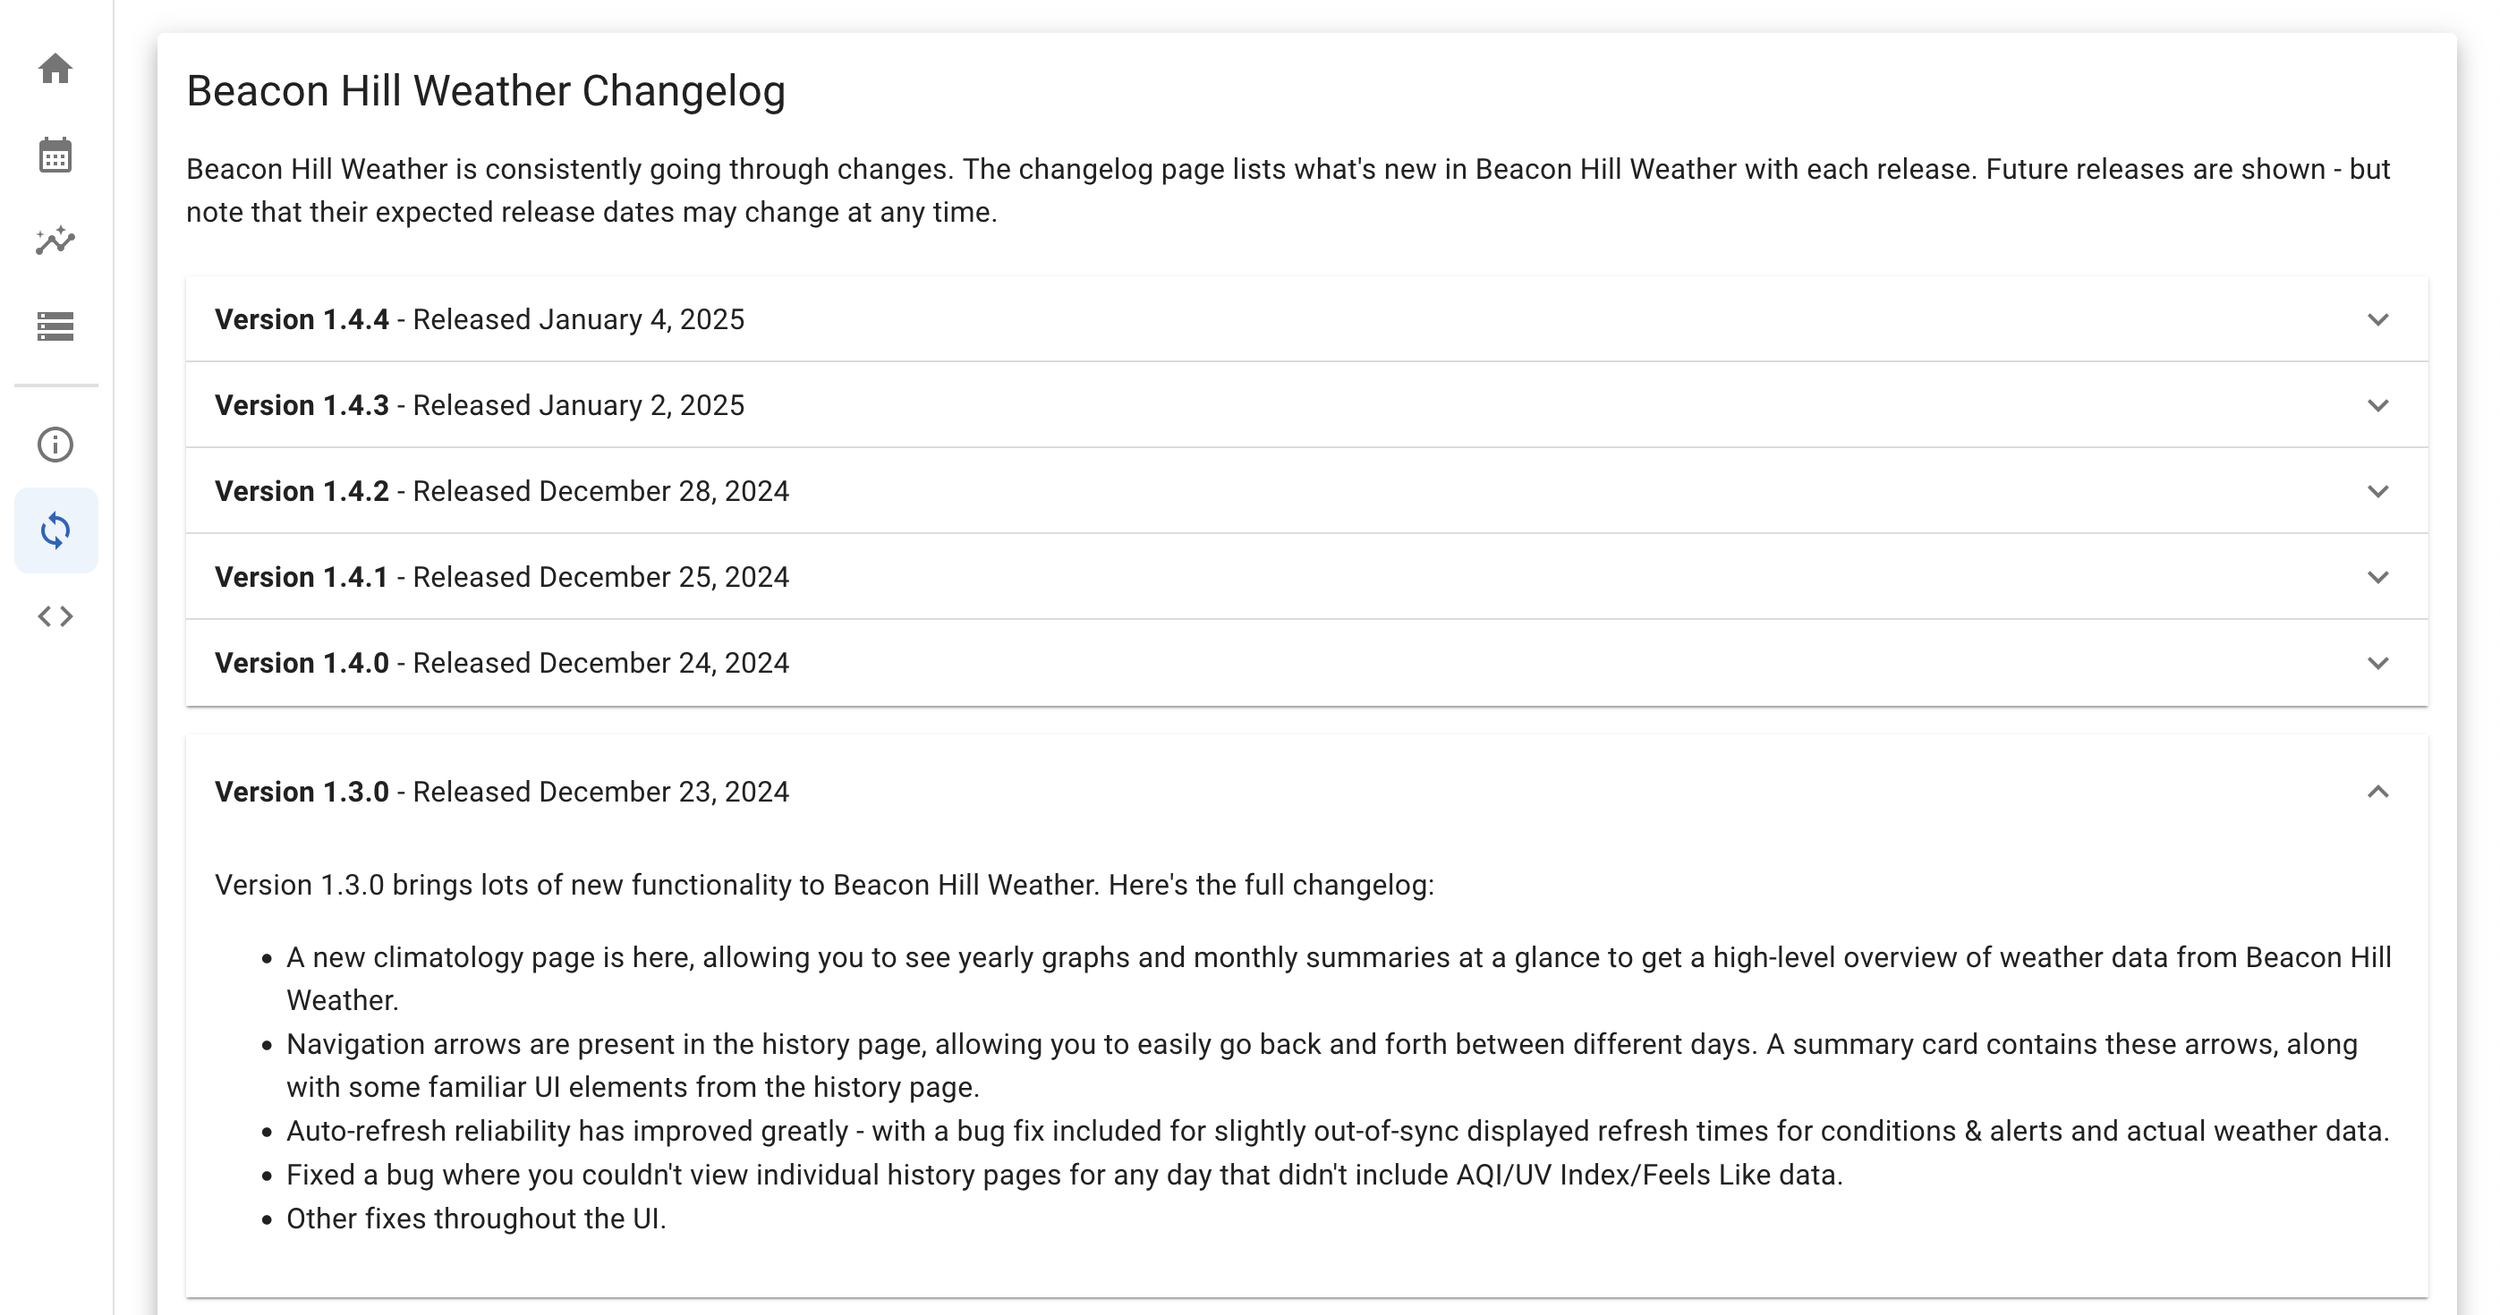
Next up is the changelog page which, well, tells you what changes in each version of Beacon Hill Weather! It’s an accordion setup within MUI that shows each version, when it was released, and then a changelog that I type up for each version.
Lastly is the public API page, which is basically a fancy redirector to the API for Beacon Hill Weather.
In the spirit of weather data being publicly accessible for anyone - I’ve done exactly the same for Beacon Hill Weather and opened up the API for anyone to use without a key.
The link takes you to a Swagger page generated by FastAPI (the library being used for the API), with interactive elements and all the routes in one convenient place!
Hopefully in the future, I can hook the station into Wunderground and the NWS CWOP (Citizens Weather Observer Program).
Oh, and did I mention there’s also dark mode? By default, Beacon Hill Weather will load into whatever your system appearance is, with options to change into manual light/dark mode. Your setting is saved to local storage.
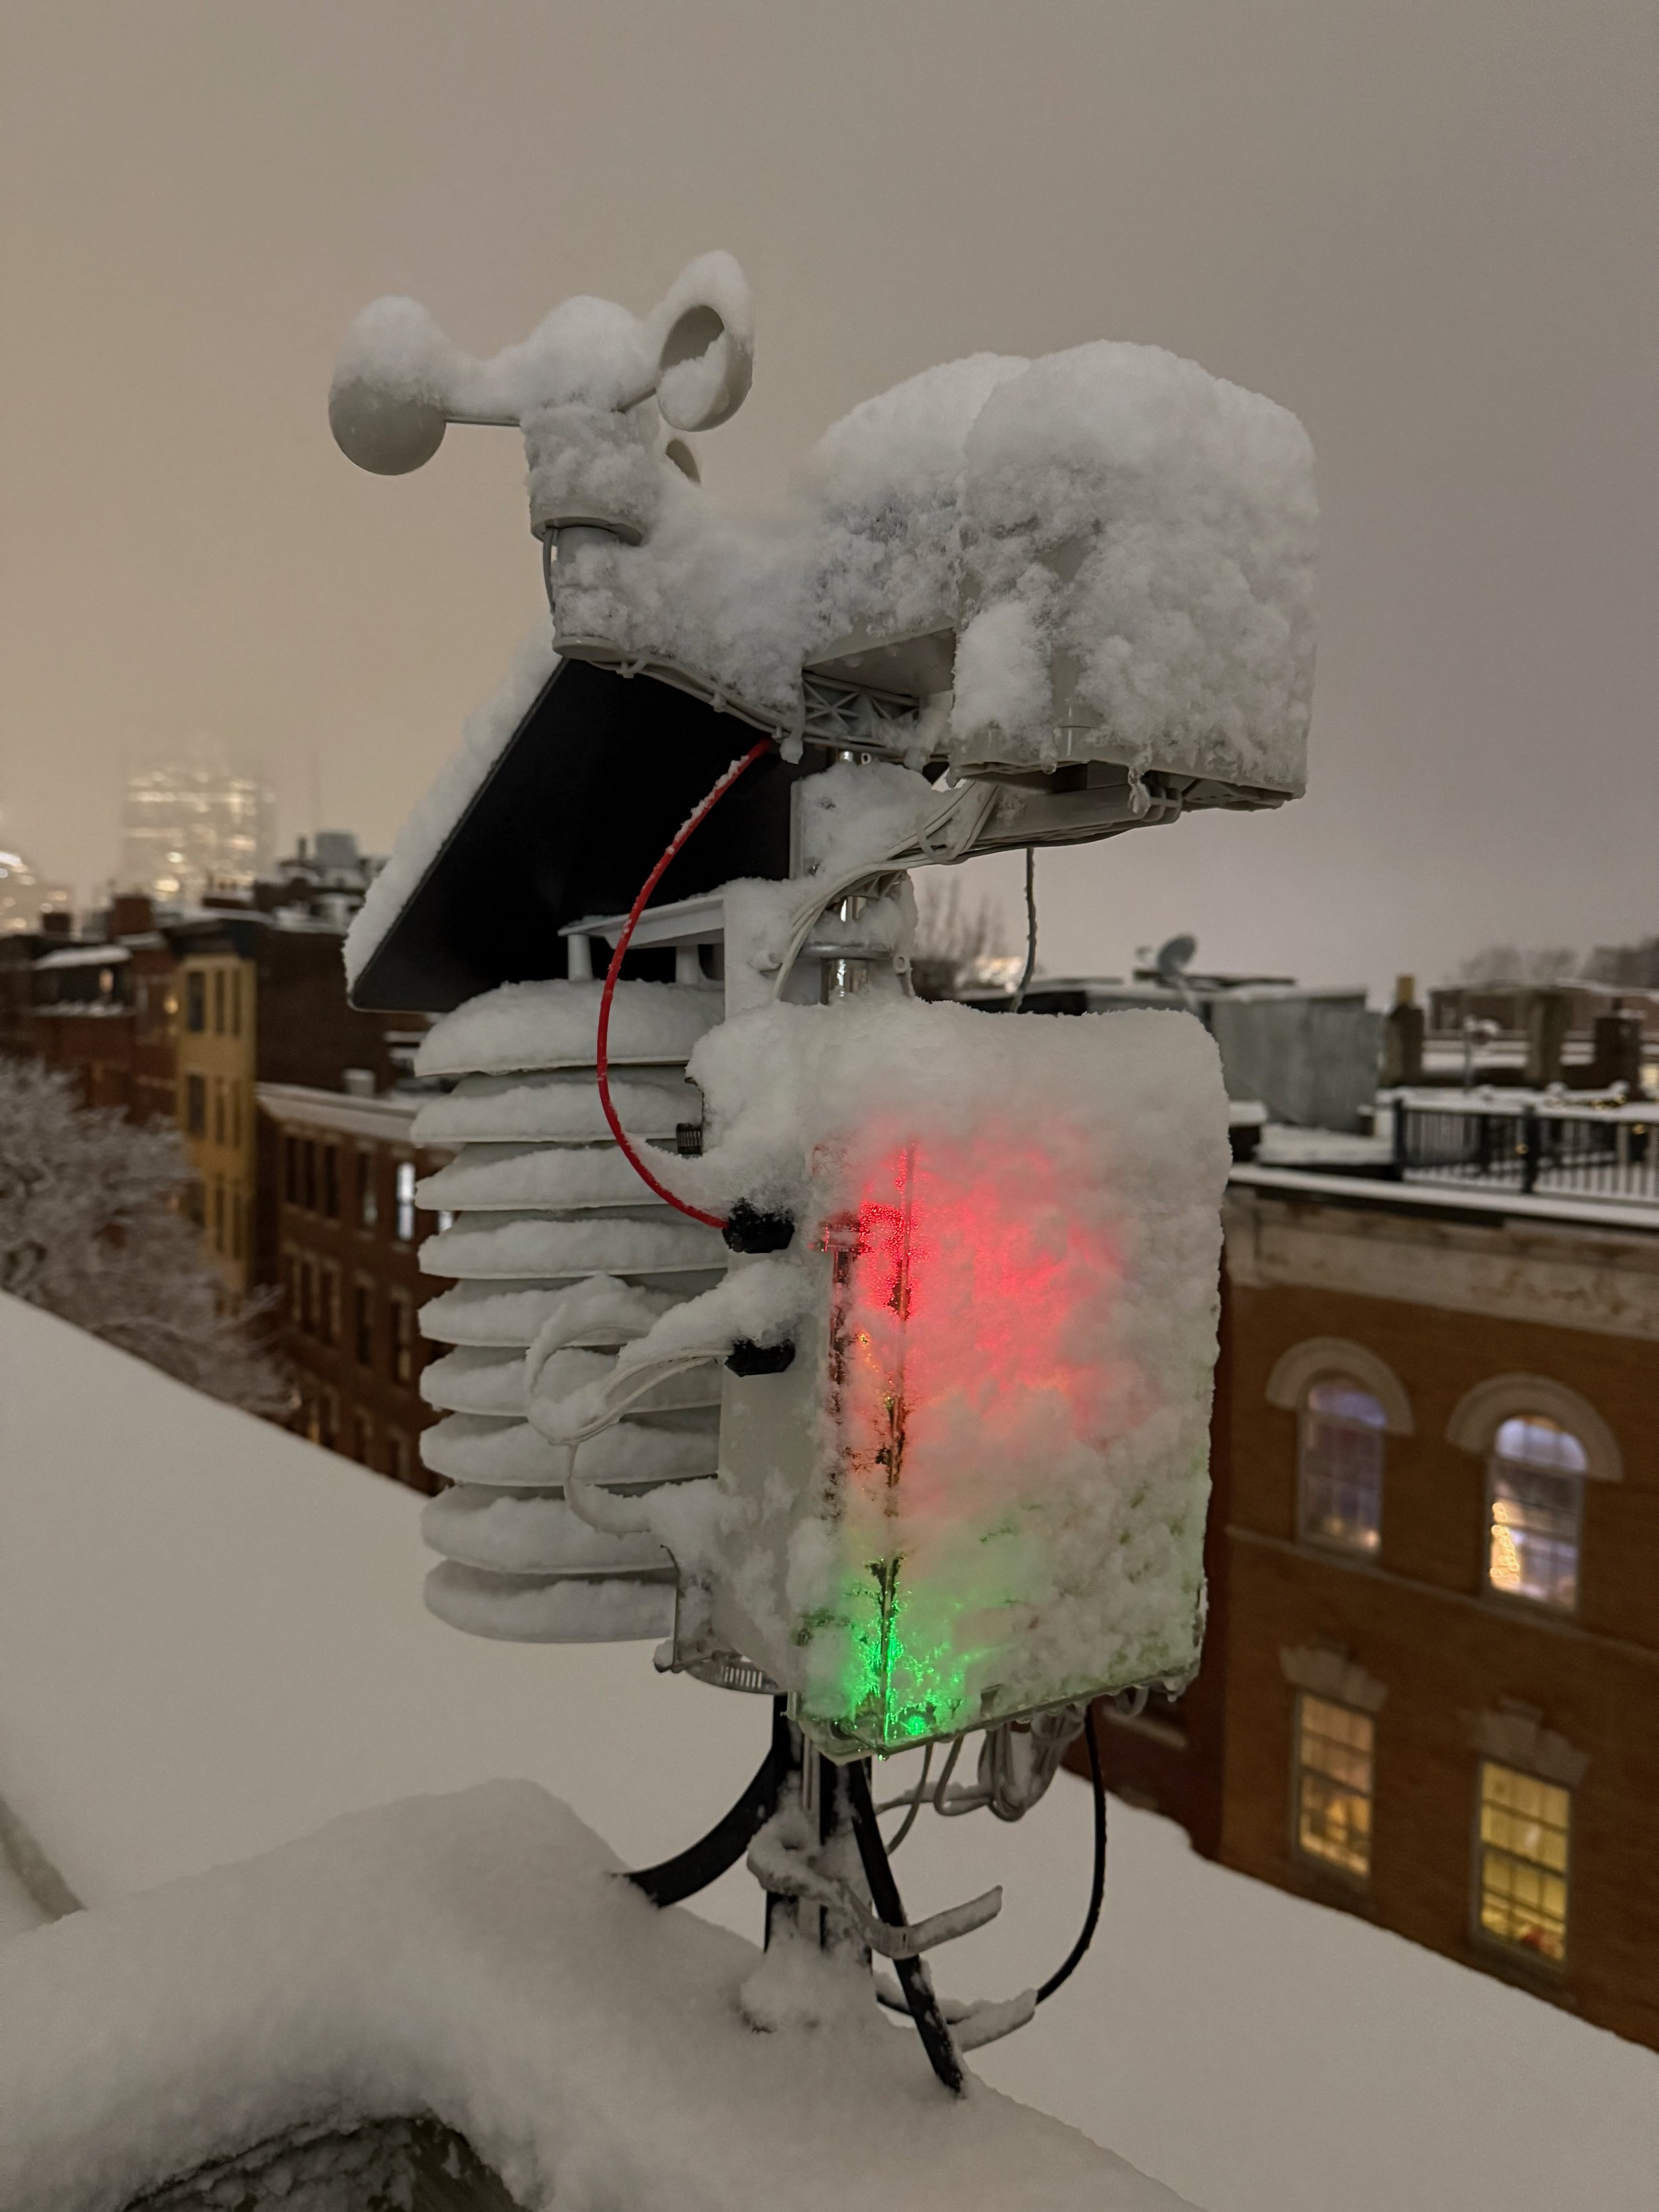
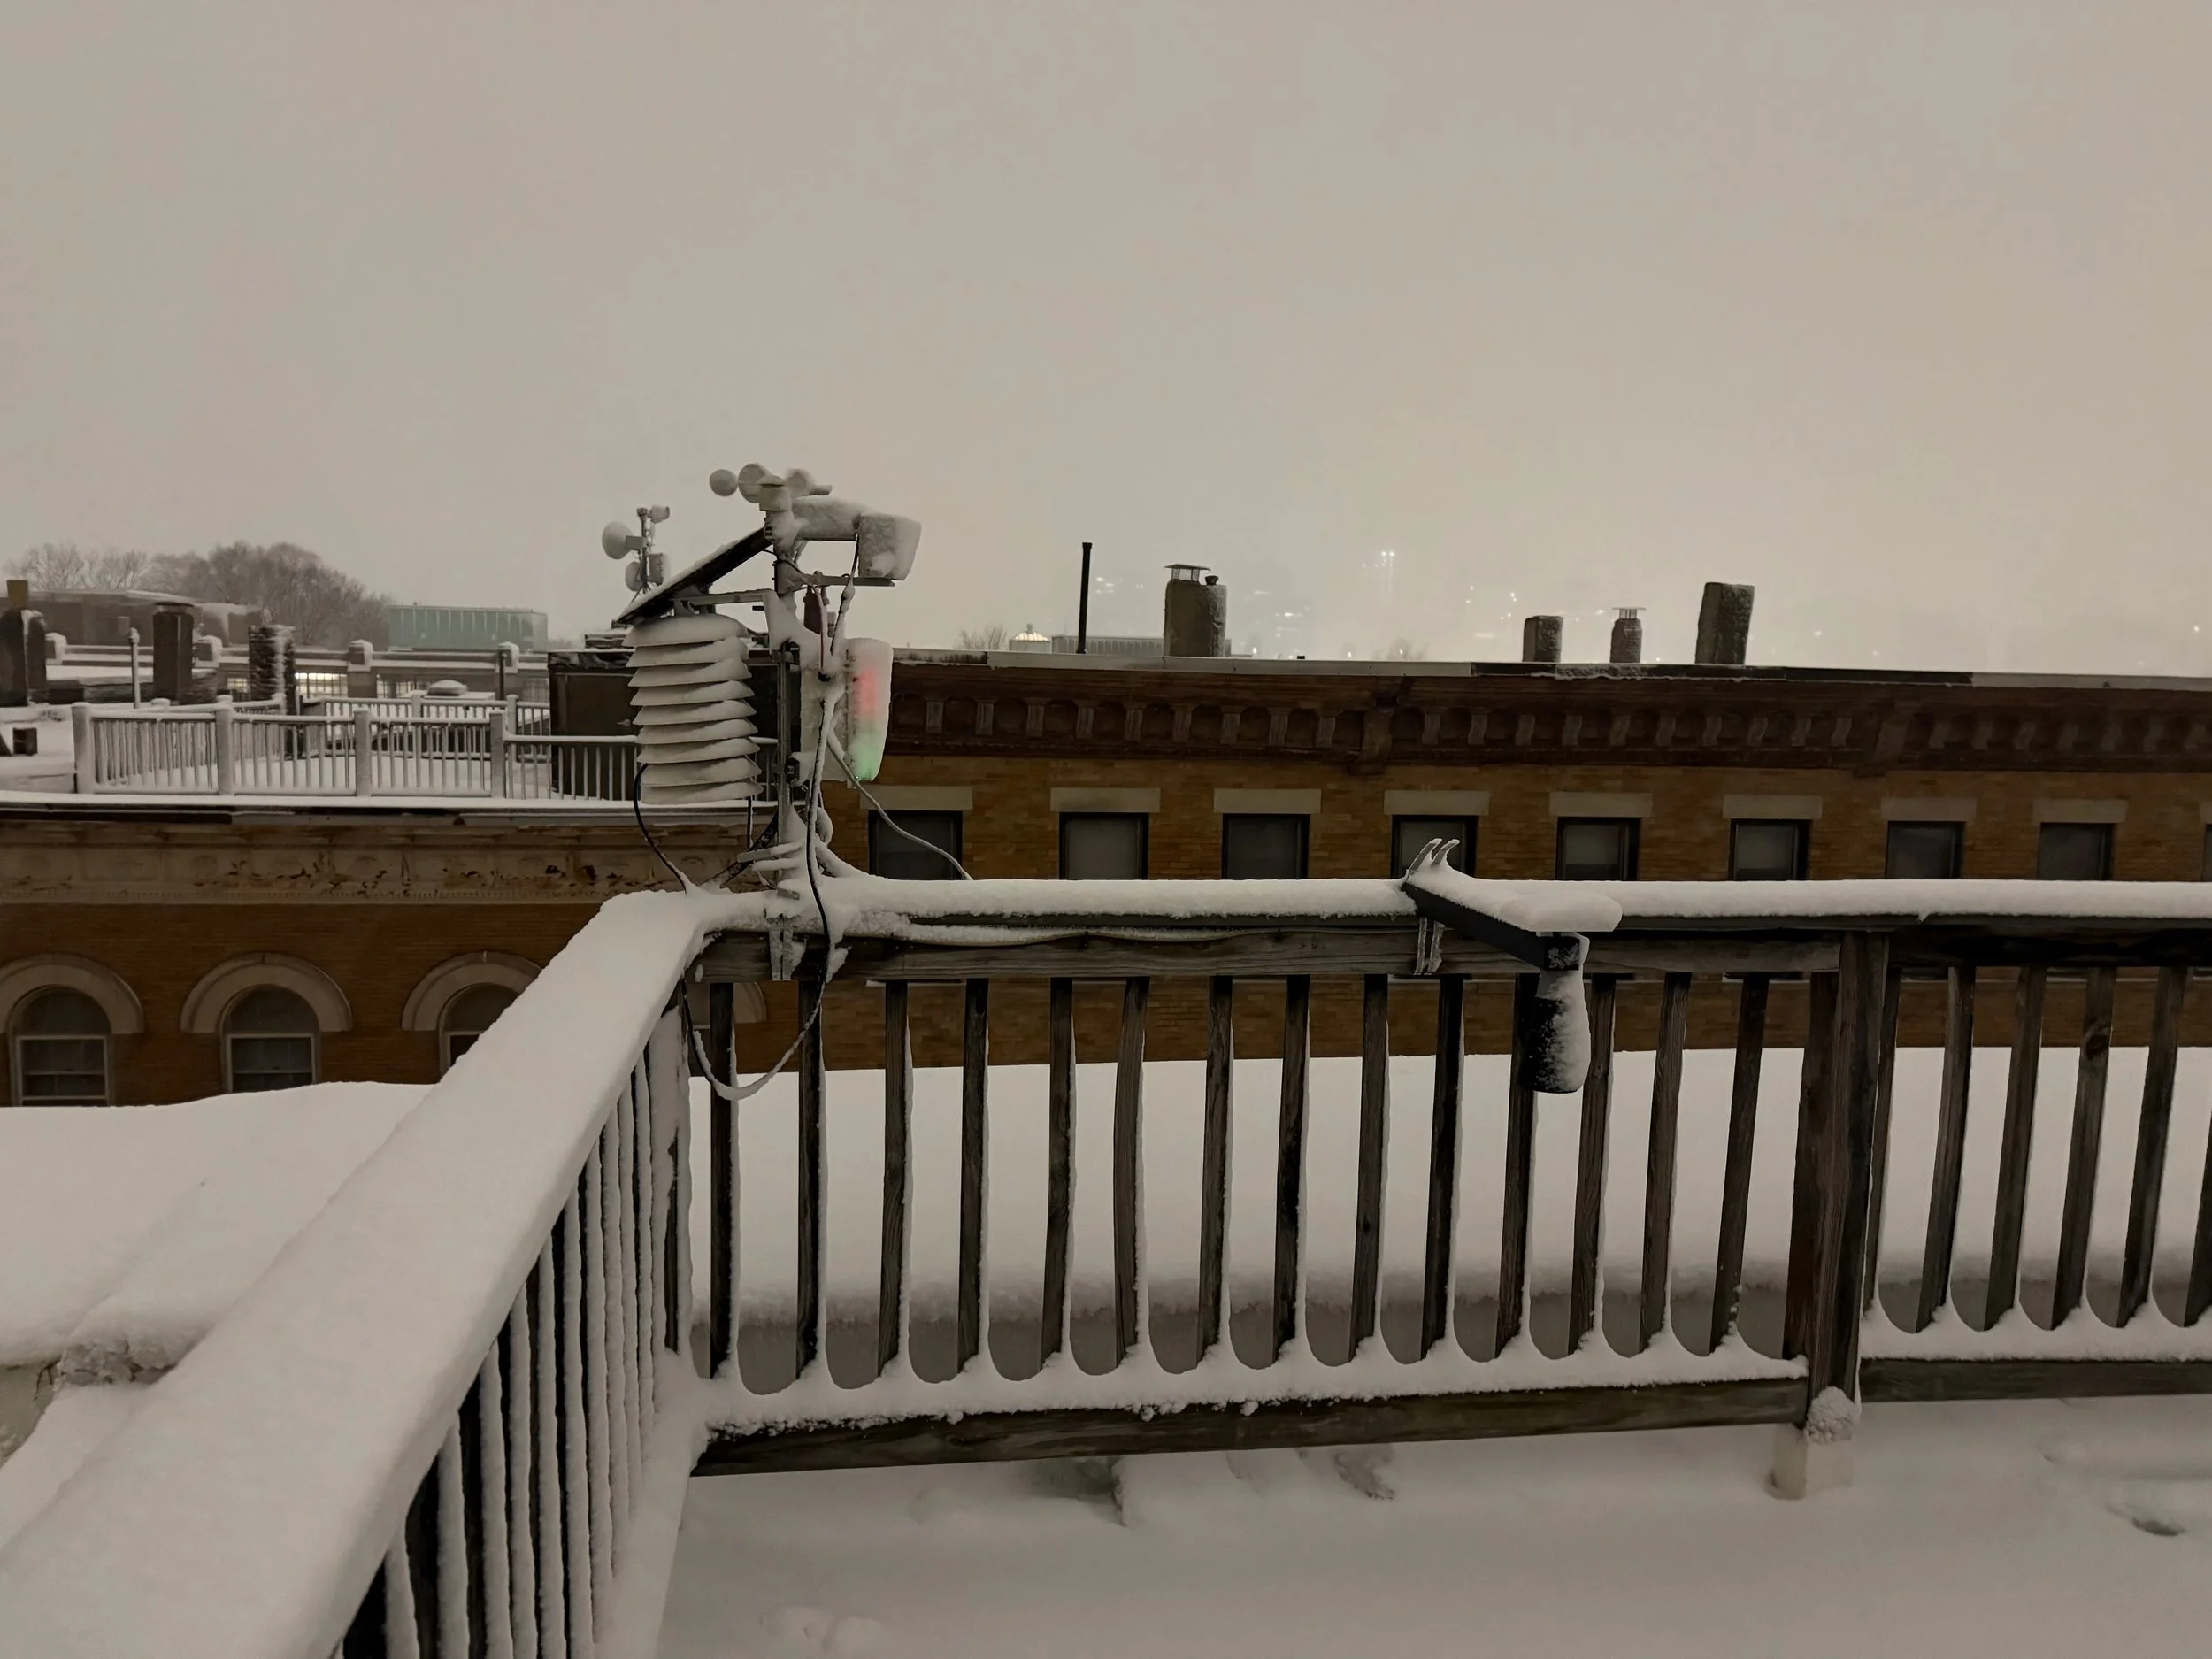
To round us off, here’s Beacon Hill Weather out during the February 2026 blizzard we had in Boston. The station kept on going like nothing was happening. The snow depth sensor got moved for this storm as certain areas on the roof have maximum snow totals (given the MB7374 can only read >500mm distance), but this is another learning for numerous improvements to the snow system in general for next winter.
Beacon Hill Weather has been an absolute joy to build and the most fun I’ve had with a project to date. It’s crazy to say I made a weather station, it sits on my roof, and it sends down accurate weather data every single minute of every single day.
This has been an incredible project, a lifelong dream of mine, and such a marvelous learning experience over the last 2 years. The best part is that I’m not done! I have many more improvements planned - two-way communications with the station, redesigning the MB7374 bracket, and tons of improvements to the software around the MB7374. All to hopefully come in time for next winter.
—
Now, in case anyone asks, Beacon Hill Weather is expensive. It’s by far my most expensive project. If I were to buy everything as it stands today, the total part cost is about $900. Including dead parts/bad batteries/unused sensors/prototyping filament, the total cost is about $1,300.
I am very, painfully aware that you can buy a Davis Vantage2 Pro Plus for ~$1,200 to $1,600 depending on your configuration. And yeah, sometimes I wish I bought one instead of building Beacon Hill Weather. I actually wanted one as a kid. My parents shot down that idea real quick (boohoo it would still be running to this day, Davis stations don’t break).
Despite Beacon Hill Weather being cheaper in part cost and much more expensive in labor, prototyping, emotional fatigue when the station goes down at 2 AM, it was a fantastic learning experience, and I’m now in the very small club (apparently < 500) of people saying they built a weather station this complex from scratch.