


PyWeather 3 is the successor to PyWeather 2, an experiment to make an e-ink weather display. It displays current conditions in detail, indoor environmental monitoring data, along with hourly and daily forecast data. In 2025, MBTA arrival times were added to the screen in place of a next-hour forecast.
PyWeather 3 is definitely no longer an experiment and has been running for about 5 years. I’ve definitely gotten use to glancing at the screen whenever I’m about to leave my apartment.
—
Timeframe: January 2021 - present
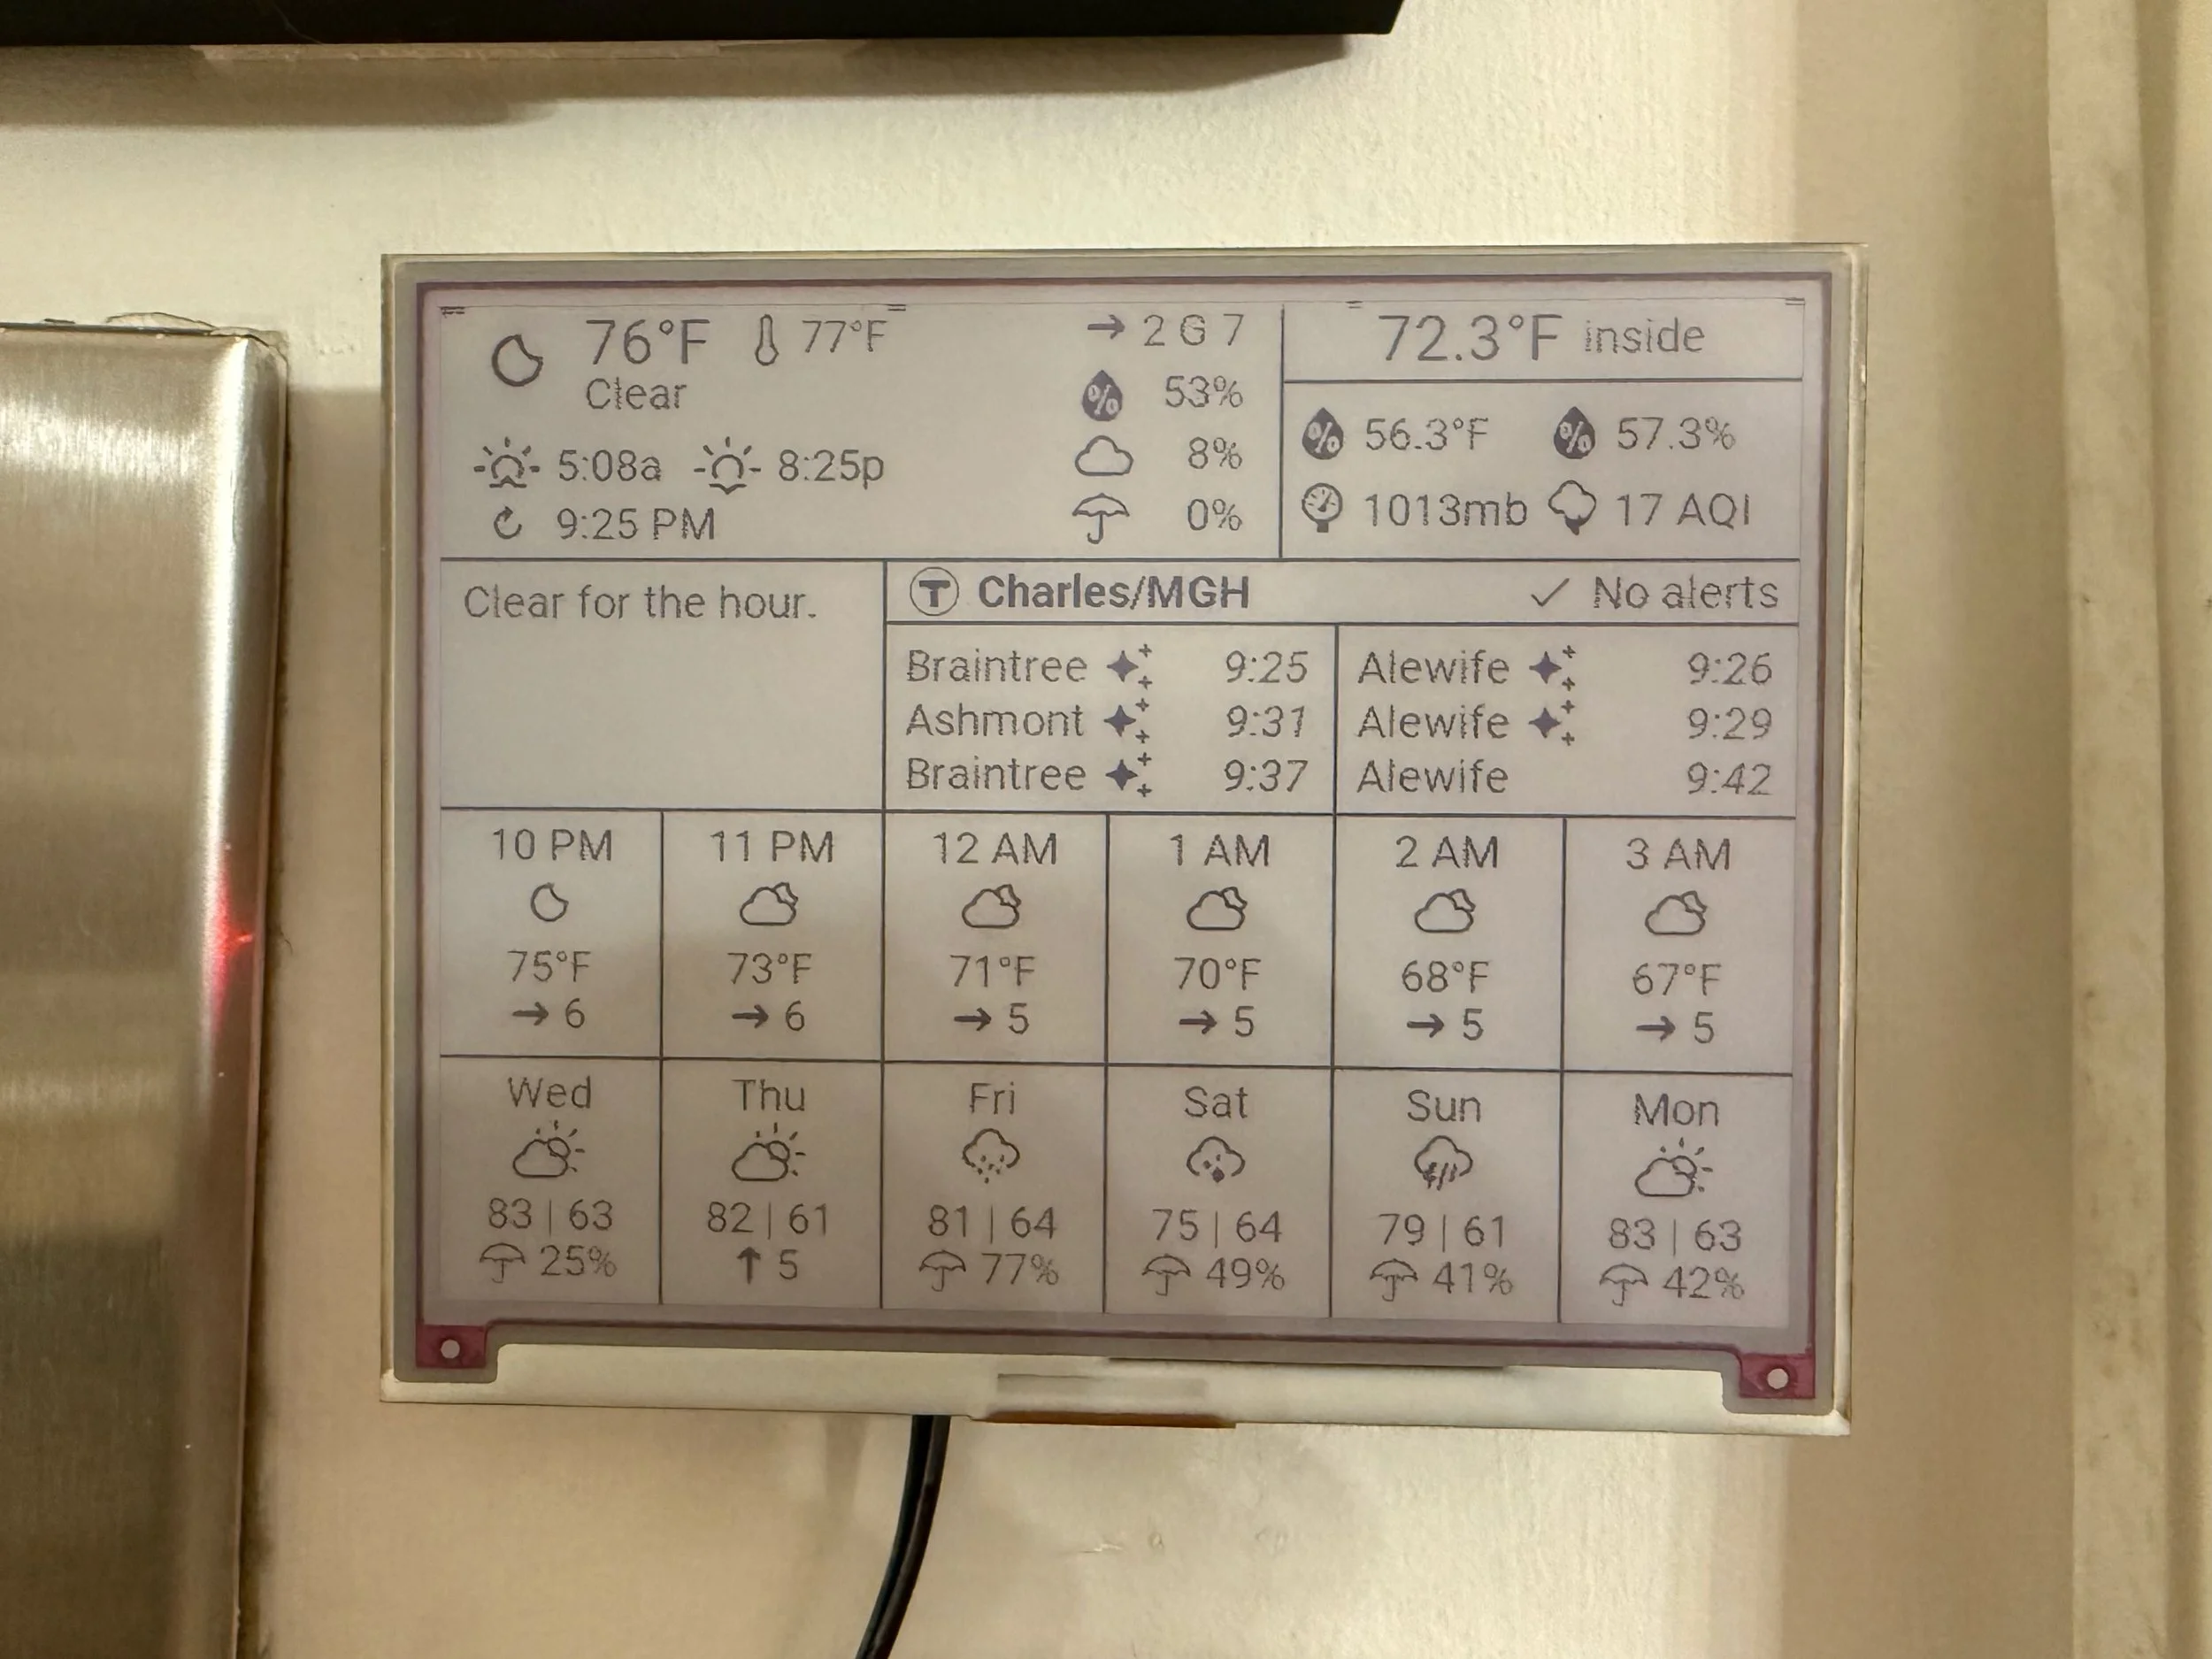
This is the present UI of PyWeather 3. Screenshots in the remainder of this post may show slightly different UI elements, so just be warned.
From the top left: current conditions show the temperature, feels like, sunrise/sunset times, and when the screen was last refreshed. This data is being fed by Beacon Hill Weather, but falls back to Apple WeatherKit if the station is down (and indicates such with a cloud around the refresh icon).
Next to that is the wind speed (also from BWH), humidity, cloud levels & precip chance, the latter of which are always fed with Apple WeatherKit.
Next to that is the indoor environmental sensors - temperature up front, dew point & humidity, pressure, and AQI, all coming from How Hot 2. The featured sensors has changed over time, you’ll see this in the page.
Below that is the hourly summary generated by my custom WeatherKitProvider library. Next to that is the segment dedicated to T arrivals at Charles/MGH, this is what came before the MBTA Screen. 3 arrivals are shown in each direction, with a small alert bar on top. If there are delays, the screen tries to extract the delay amount and show “Delays: 15 mins”, for instance. There’s a lookup for other alert types, if all else fails, it shows “Delays” or “1 alert”, multiple alerts always condense to “2 alerts”. Icons are shown for new trains or 4-car trains.
The bottom two rows are dedicated to the grid for the next hour conditions and daily conditions. Wind speed & direction is shown, but if precip chance is >25% for the hour/day, that is shown instead. The hourly temperatures are corrected using Beacon Hill Weather data (i.e. if WeatherKit thinks it’s 80, but BWH says 83, hourly temps on the forecast go up by 3 degrees).
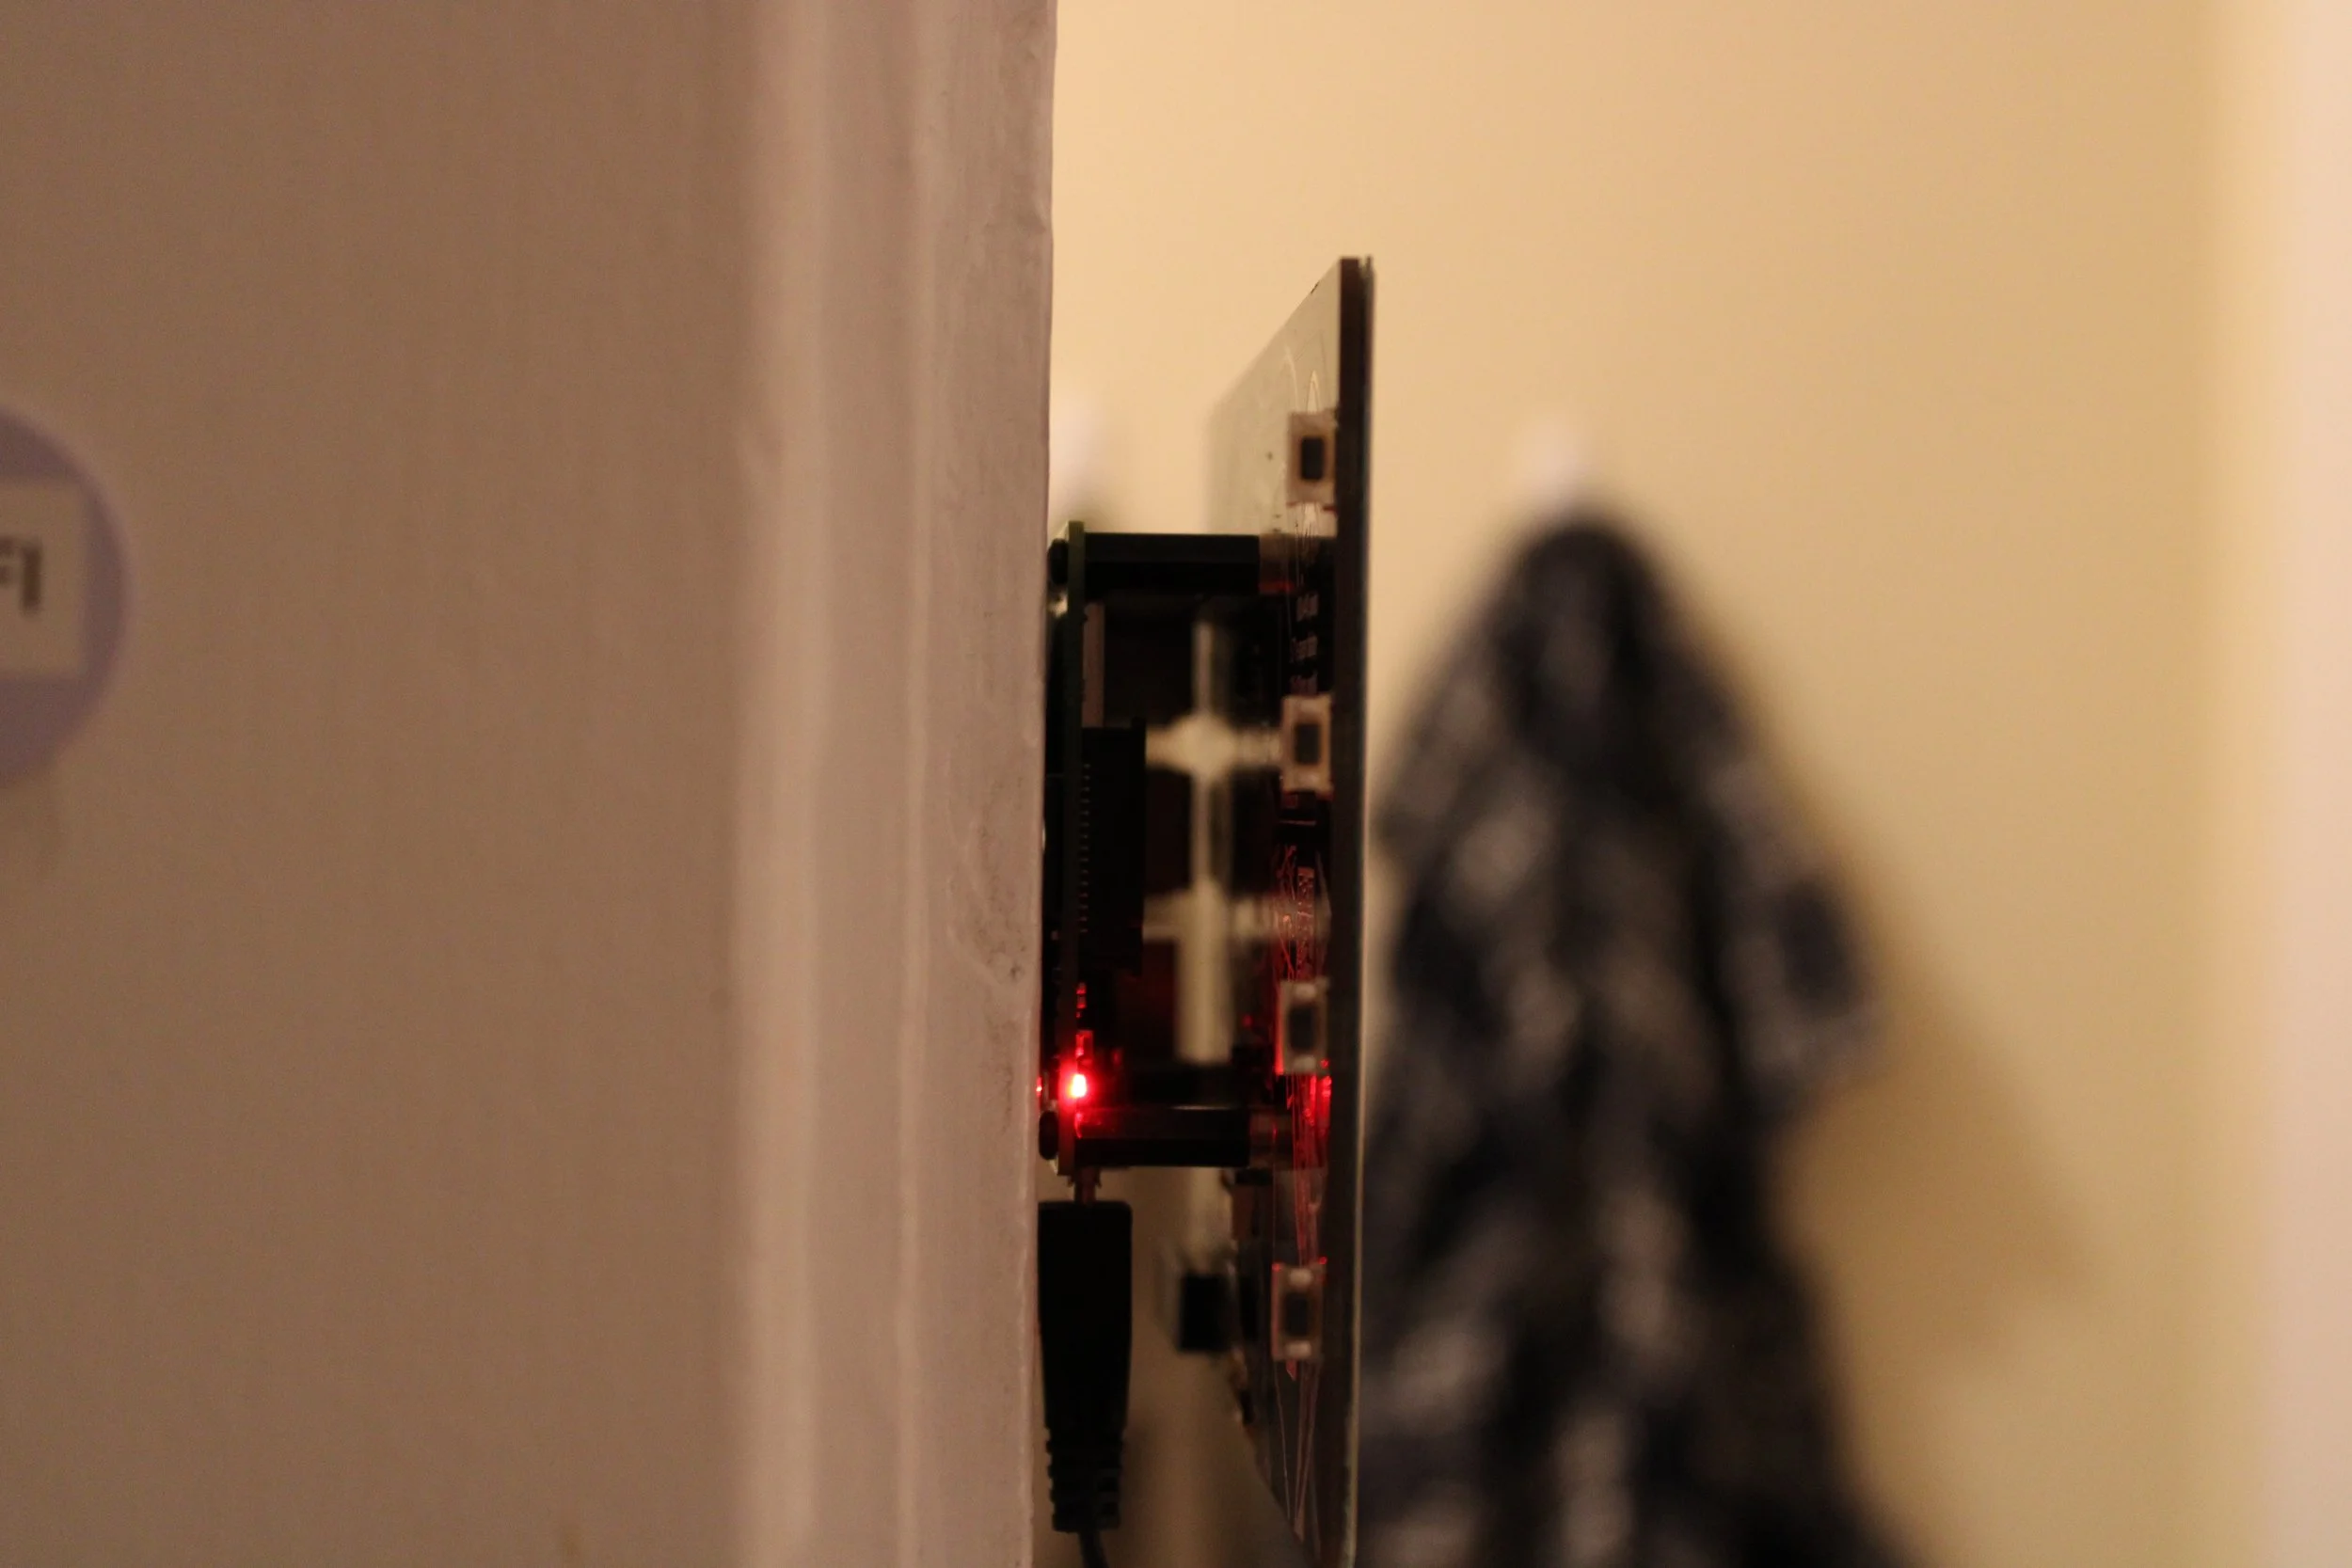
In previous iterations, the UI had light sensor readings and a full 15-minute forecast. Additionally, PyWeather 3 actually hosted the sensors for How Hot 2 (you can see the wires coming off the top in this photo, and a sensor to the right), but this is no longer the case.
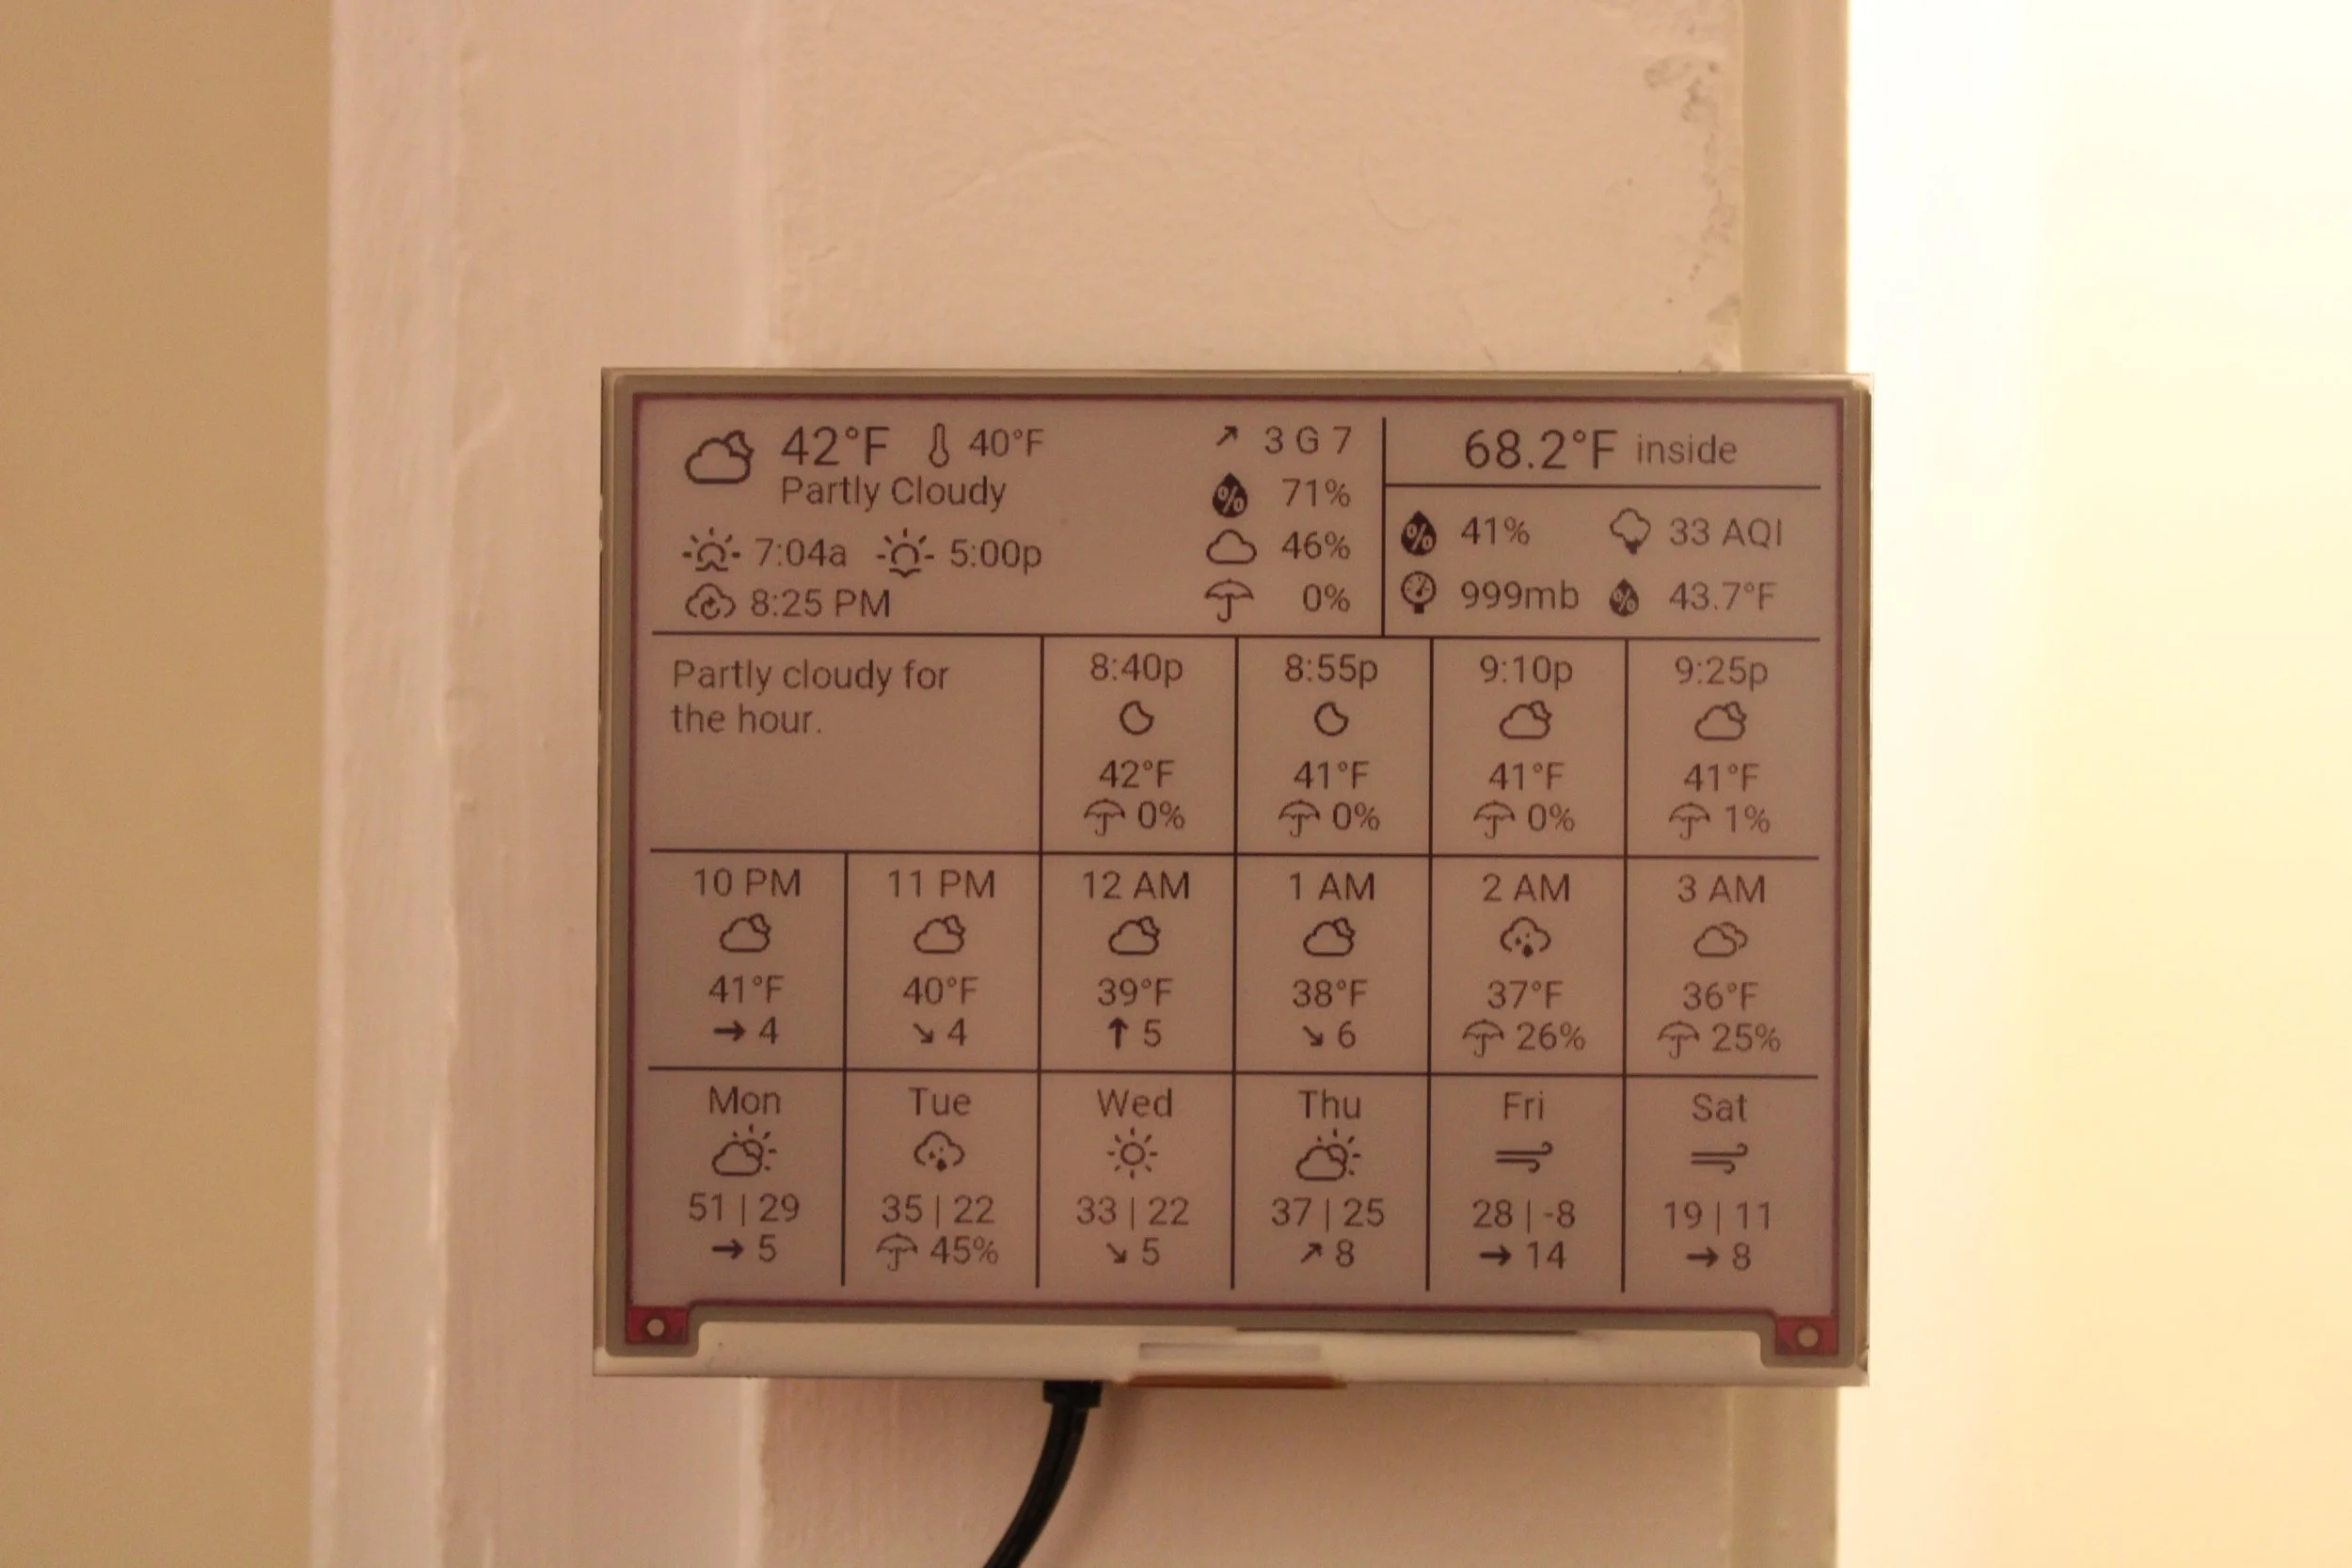
When weather alerts are active - the area dedicated for detailed indoor sensor data is replaced with what the alert is, and when it expires. Indoor temperature is visible at all times.
Here’s another image of PyWeather 3 in the wild, graciously provided by my DSLR so that’s why the image quality is so good. Here you can see the indoor sensor icons were not aligned that well!
Here’s the side profile view where you can see how it’s mounted with the Pi 3A+.
At some point in PyWeather 3 development, I wanted to make it so clicking one of the four buttons expanded details for each section (because coincidentally there’s four sections on the display that literally line up with the buttons), but that hasn’t happened just yet.
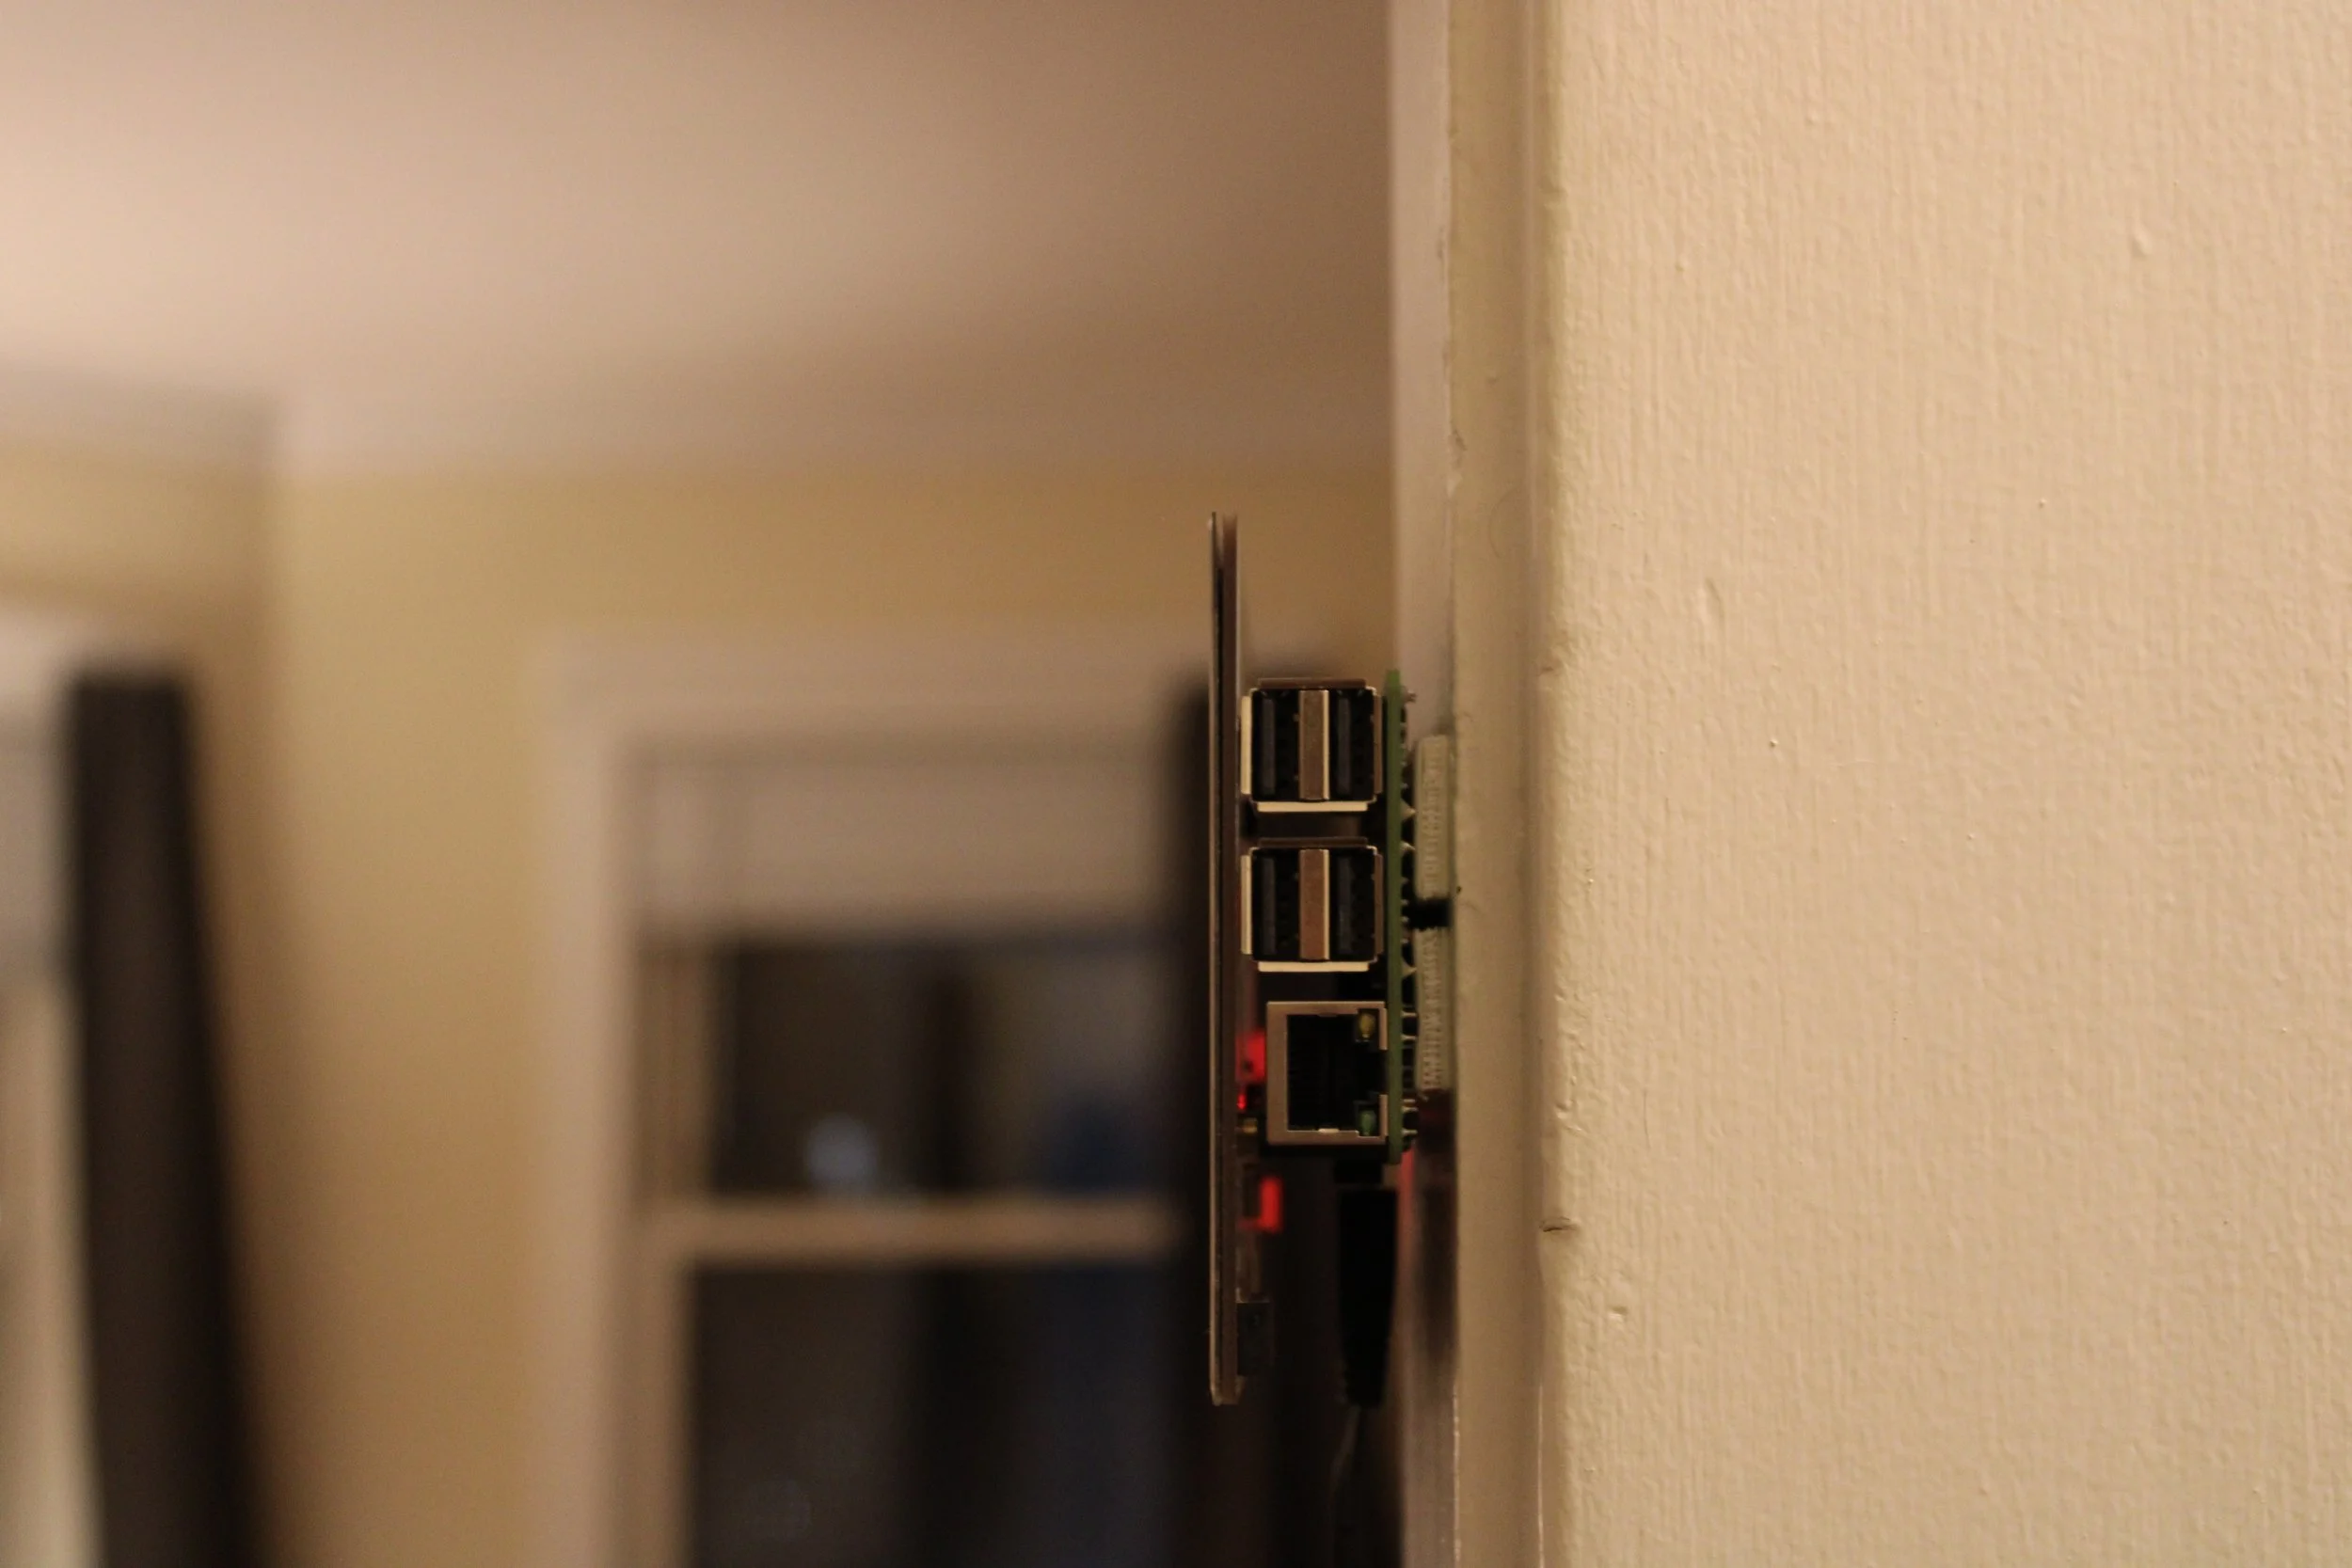
And here’s a side view of the Pi, lovingly mounted with command strips. That’s how it continues to be mounted today!